Tony Blair took a selfie in front of an oil field on fire several years ago. Back then oil had been a sleep commodity, but this may have given it the taste of the limelight. Today closes out trading for May. And after 5 months crude oil is keeping everyone on their toes. The rhetoric has been overblown on both sides of the trade. It is oversold or overbought. A reversal or a dead-cat bounce. Every month this year has been an interesting one from a technical perspective for crude oil as well. Take a look.

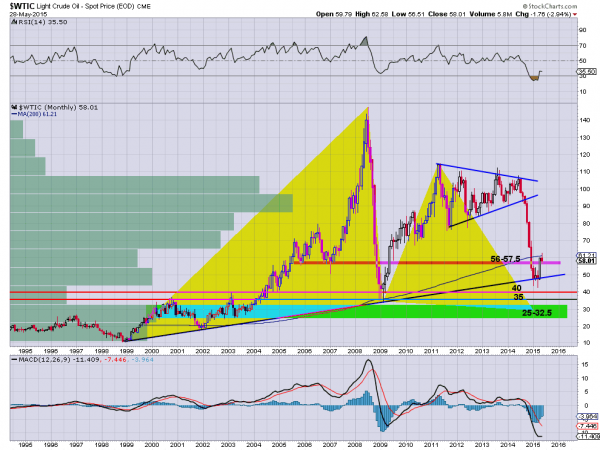
The monthly chart above is the key. And there are 3 things to focus on as we move into June. First is the 16 year rising trend support line. This line has no meaning other than it has been touched 4 times and each time it has held as support. That is what makes it an important are to watch. The strong move higher in April off of the last touch has held up to date.
The second is the prior support area from 56 to 57.50. This was support in 2005 and 2007 and may be support again on the pullback or consolidation of the move up from April. The third is the 200 month simple moving average (SMA). This line had acted as support in 1999, 2002 and 2009. The move lower that started last July blew through this level, but the reversal higher sees the price back at that level. May looks to have failed to break back through. Will June be the break through month or will it be a classic retest and then move back lower.
With all these moving parts June looks to be the 6th month in a row that Oil will play a major part in traders market views. It certainly has quickly gone from doing nothing for 4 years to loving the limelight.
The information in this blog post represents my own opinions and does not contain a recommendation for any particular security or investment. I or my affiliates may hold positions or other interests in securities mentioned in the Blog, please see my Disclaimer page for my full disclaimer.
