Oil jumps 1.5% as Egypt, Saudi Arabia, Bahrain and the United Arab Emirates effectively create a land and air blockade of Qatar.
All four countries are severing diplomatic ties and air, land and sea links with Qatar. Saudi Arabia is also closing its land borders with the natural gas giant, meaning that imports will have to arrive either by sea to Qatar, or via air from third countries. Qatari diplomats have been given 48 hours to leave the other countries, and Qatari visitors and residents in those countries must leave within 14 days.
The heart of the dispute appears to be Qatar’s support of the Muslim Brotherhood in Egypt and the Hama’s Islamic Fundamentalists in Gaza and the Palestinian territories. They also are accused of assisting Iran’s alleged miscreance within the region supporting various Iran aligned factions within the other countries. Oblique passing shots appear to be being made vis a vis Al Jeezera news service, owned by and based in Qatar.
ETIHAD AIRWAYS SPOKESMAN SAYS AIRLINE IT WILL SUSPEND FLIGHTS TO AND FROM QATAR FROM TUESDAY MORNING source: Reuters
Emirates will surely not be far behind. (sic)
The suddenness and aggressiveness of the effective blockade of Qatar have caught energy markets wrong-footed this morning. We have yet to see Qatar (or Iran’s) response to this, but oil is marching higher with Brent crude up 1.50% so far. If nothing else, Qatar being sent to the naughty spot by its neighbours has highlighted the vulnerability of oil markets to potential supply disruptions from the Middle East.
It is a rapidly developing situation and means that for now, traders should remain glued to their news feeds as oil and natural gas will trade of headlines rather than fundamentals.
Brent Crude
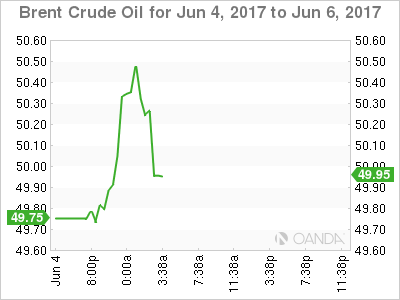
Brent spot is 1.40% higher at 50.43 as I write. Having broken its overnight highs at 50.30, this becomes intra-day support with the next resistance at 51.00 and then 51.50, the 200-day moving average.
WTI
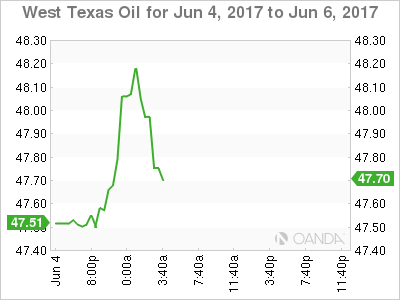
WTI spot has jumped 1.35% to 48.15, breaking its New York high at 48.00 which becomes intraday support. Its next resistance is 49.00 followed by 49.35, the 200-day moving average.
Natural Gas
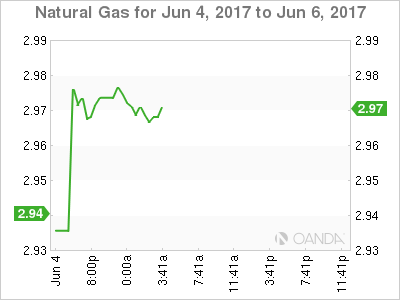
Natural Gas is 1.10% higher in thin Asian trading. Qatar is one of the largest exporters of natural gas globally, and the threat of supply disruption could see prices escalate.
Natural gas trades at $2.970 per 10,000 million British thermal units (mmBTU’s), just below it’s New York high at 2.976 and initial resistance. Next resistance is at 3.050, just below it’s 100 and 200-day moving averages.
Gold is unmoved for now, which is somewhat surprising. However, an escalation of the situation could see risk aversion buying appear.
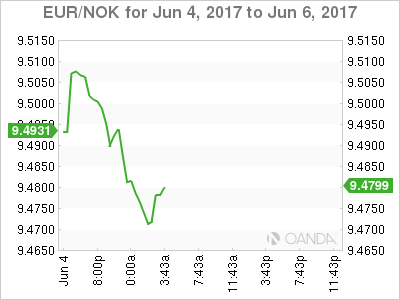
Petro-currencies are also rallying with both NOK and CAD being bought as energy prices move higher vis EUR/NOK and USD/CAD.
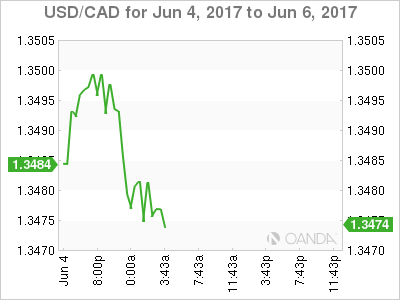
Overall this is a potentially very serious and very surprising concerted action by the GCC’s largest players. Energy will trade of headlines in the short term as the events on the ground evolve. An aggressive response by Iran which is also being tarred by the same brush could see volatility rise to new levels again in the energy contracts. Its potential effect on the OPEC agreement should the situation drag on, will be a story for another day.
