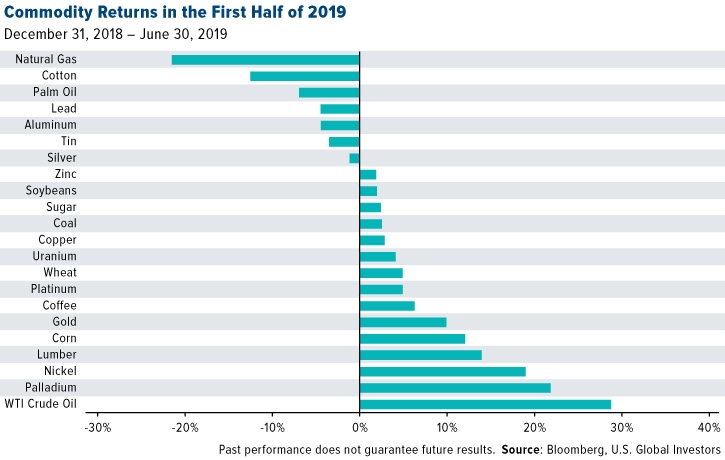
Commodities were on mostly sound footing in the first half of 2019. The S&P GSCI returned more than 13 percent as of June 30, one of the best first six months in recent memory. It was not without its challenges, though.
In a repeat of last year, crude oil was the top-performing commodity, up 28.76 percent as of June 30. Price action was driven mostly by tensions in the Middle East as well as extended supply cuts by the Organization of Petroleum Exporting Countries (OPEC) and its allies. Global growth concerns began to put pressure on oil in April, but prices surged following June’s attack on two tankers near the Strait of Hormuz, for which the U.S. blamed Iran.
At a meeting in Vienna this month, OPEC settled on maintaining quotas for another nine months. “The rollover of curbs into a fourth year shows oil producers are ever more bogged down in a struggle to wrest control of the market from the booming U.S. shale industry,” according to Bloomberg. OPEC’s dominant producer, Saudi Arabia, will likely continue to do the heavy lifting.
Palladium Still the Highest Valued Precious Metal
In second place was palladium, up 21.86 percent. In January, palladium—a key ingredient in catalytic converters, which reduce pollutants in car fumes—became the most expensive precious metal after it surpassed gold for the first time since 2002. Last month, for the second time this year, the metal broke above $1,600 an ounce.
As I’ve explained before, the metal is surging because it’s not only in high demand thanks to tougher emissions standards around the world, particularly in Europe, but it’s also expected to post another year of supply deficits. 2019 should mark the eighth straight year of deficits, according to Metals Focus. That’s largely because around 80 percent of all palladium (and platinum) production is concentrated in two countries—South Africa and Russia. The geopolitical risks, then, are very high. Just last month, we saw aggressive wage negotiations begin in the South African platinum mining industry. The Association of Mineworkers and Construction Union (AMCU), one of the groups involved in these talks, has called for a whopping 48 percent rise in the minimum wage.
A Disappointing Showing for Copper
Besides silver, down 1.17 percent, one of the biggest disappointments so far this year has been copper, despite being up (slightly) in 2019. Back in February, I predicted that this would be copper’s year on higher demand related to renewable energy. The trade war between the U.S. and China, however, had different ideas.
I wasn’t the only one who saw big things for the red metal. Morgan Stanley (NYSE:MS), Citi and Goldman Sachs (NYSE:GS) all made bullish calls on copper, with Morgan Stanley projecting a 14 percent upside this year on a widening supply deficit.
I’m still optimistic. According to Bloomberg, copper use should top world production this year by some 189,000 metric tons. Codelco, the world’s largest miner of the metal, said that demand in China remains robust despite trade tensions and that the recent selloff was not justified.
Silver Slips
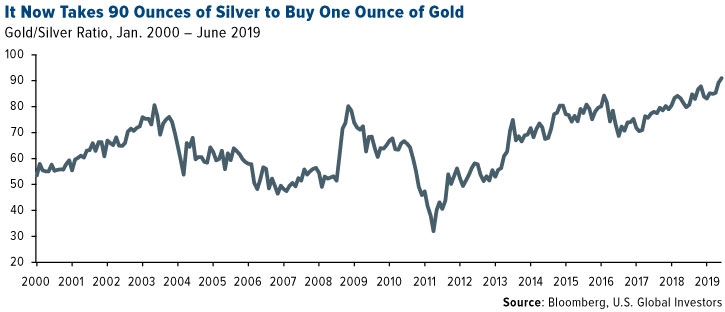
Speaking ofsilver, in June it took as many as 90 ounces of the white metal to buy just one ounce of gold. This is way above the average of around 65 over the past 20 years. Whereas appetite for gold has soared in response to negative yields around the world and fears of slowing economic growth—the yellow metal cleared $1,400 an ounce last month for the first time since 2013—silver has continued to trade sideways. Many investors might be baffled by this, but keep in mind that half of all silver demand comes from industrial applications. And when this demand cools, the price of silver falls.
U.S. Awash in Natural Gas
The worst performing raw material in the first half of the year was natural gas, down 21.5 percent. This should come as no surprise, as the U.S. has an incredible surplus of the stuff right now thanks to the ingenuity of the fracking industry. Last year, U.S. gas production rose to a record of 37 trillion cubic feet, a remarkable 44 percent increase from a decade earlier. The country is now the world’s gas production leader, providing around 21.5 percent of supply in 2018.
Think of low energy prices as a huge tax cut. This past spring, natural gas in West Texas fell to as low as negative $9 per million British thermal units. Producers were literally paying consumers to take the stuff off their hands. Facing overproduction, Texas drillers are even shooting excess gas back into older wells.
In its Gas 2019 report, the International Energy Agency (IEA) estimates that natural gas demand will rise 1.6 percent annually until 2024, as a cleaner alternative to coal.
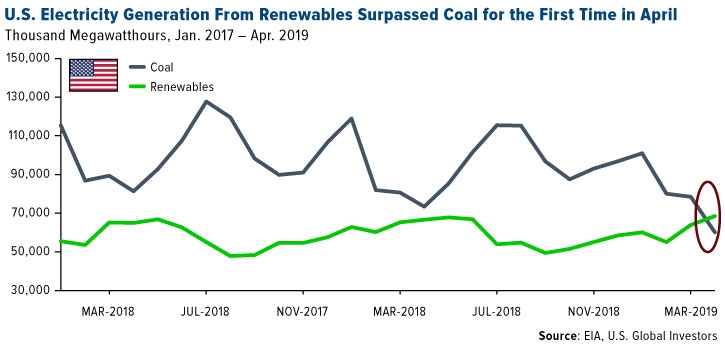
And while I’m on the topic, for the first time in U.S. history, the amount of electricity generated by coal in April fell below that of renewables such as wind and solar.
In fact, Bloomberg New Energy Finance (BNEF) now predicts that nearly half of the world’s electricity will come from wind and solar by 2050. New York State, for instance, passed the most aggressive clean energy target in the nation that seeks to significantly boost solar and wind capacity. At the beginning of the year, Germany announced it would close all 84 of its coal-fired power plants over the next 19 years in order to combat the effects of climate change.
All in all, commodities look very favorable right now, as they’re highly discounted relative to stocks. Should inflation really begin to pick up, I think we ought to see the price of materials soar.
Disclaimer:
All opinions expressed and data provided are subject to change without notice. Some of these opinions may not be appropriate to every investor. By clicking the link(s) above, you will be directed to a third-party website(s). U.S. Global Investors does not endorse all information supplied by this/these website(s) and is not responsible for its/their content.
The S&P GSCI Total Return Index in USD is widely recognized as the leading measure of general commodity price movements and inflation in the world economy. Index is calculated primarily on a world production weighted basis, comprised of the principal physical commodities futures contracts.
Holdings may change daily. Holdings are reported as of the most recent quarter-end. None of the securities mentioned in the article were held by any accounts managed by U.S. Global Investors as of 6/30/2019.
U.S. Global Investors, Inc. is an investment adviser registered with the Securities and Exchange Commission ("SEC"). This does not mean that we are sponsored, recommended, or approved by the SEC, or that our abilities or qualifications in any respect have been passed upon by the SEC or any officer of the SEC. This commentary should not be considered a solicitation or offering of any investment product. Certain materials in this commentary may contain dated information. The information provided was current at the time of publication.


