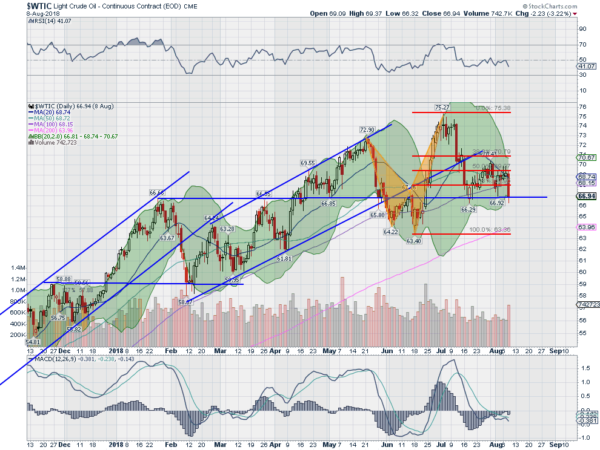
Crude oil ended a strong run higher in January and morphed into a sideways price action, pulling back to support at December resistance. It remained in the sideways channel until April. It had already started another run higher in a channel in February but did not reveal it until making a higher high in April. That move peaked out in May and the price came back to retest the January high again, this time falling below it before finding support.
Retracement
Another bounce had crude oil tracing out a bearish Shark harmonic. That pattern completed in July and oil started to move lower. First support occurred at a 78.6% retracement of the pattern in mid July. It has bounced from that and is now falling back again, at the 78.6% retracement.

Did you notice where that 78.6% retracement falls? Right in line with the January high. This price level continues to show importance. A drop below this 66.50 area could lead to a slippery future for crude oil. First, there would be a full retracement to the June low. That would be the first touch at the 200-day SMA since October last year. A Measured Move lower would target 60.50 below that. Momentum supports continued downside at present. Keep an eye on 66.50 as below that I see a slippery slope lower.
