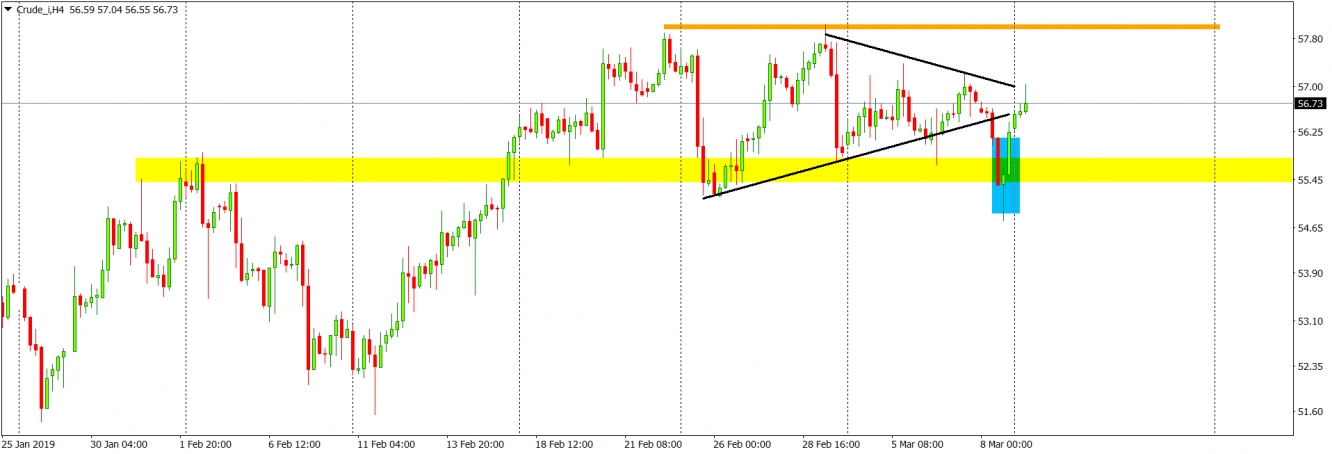
On Friday, WTI oil took a hit, with the price shedding nearly 2 USD a barrel. By the end of the day, the asset had managed to recover nearly all of its losses, but what could be the reason behind such volatility and momentum? A quick look at the calendar shows no major data for the oil market. OPEC? Nope. Ahhhh NFP, yes! That report has the potential to shake markets to their foundations, especially when the reading comes out way below estimates. But wait a minute, after the NFP report, USD went into decline, which should help crude to climb higher in theory, so this doesn’t explain the drop that happened beforehand…
Here it is: “Norway's $1 Trillion Sovereign Wealth Fund Is Dumping Oil Stocks”. This news definitely sent energy companies tumbling and most probably had also an impact on the price of oil itself. However, this was only temporary as we can see now. On Monday, on the other hand, we got some positive news for crude as the Saudis committed to further production cuts in the month ahead. That news has helped to push the price even higher and cover the tops from Friday’s candlestick.
From a technical point of view, the drop from Friday involved a bearish breakout from the symmetrical triangle pattern. In addition to that, we broke the horizontal support at 55.7 USD/bbl. (yellow). The pullback created the false breakout pattern (blue), which very often produces a buy signal. We are back above the support and inside the symmetrical triangle pattern. Most of the time, when the price behaves like this, the resulting upswing continues and the bullish setup is profitable. We’ll see if that is the case here too. As long as we stay above the yellow support, the sentiment is positive.

