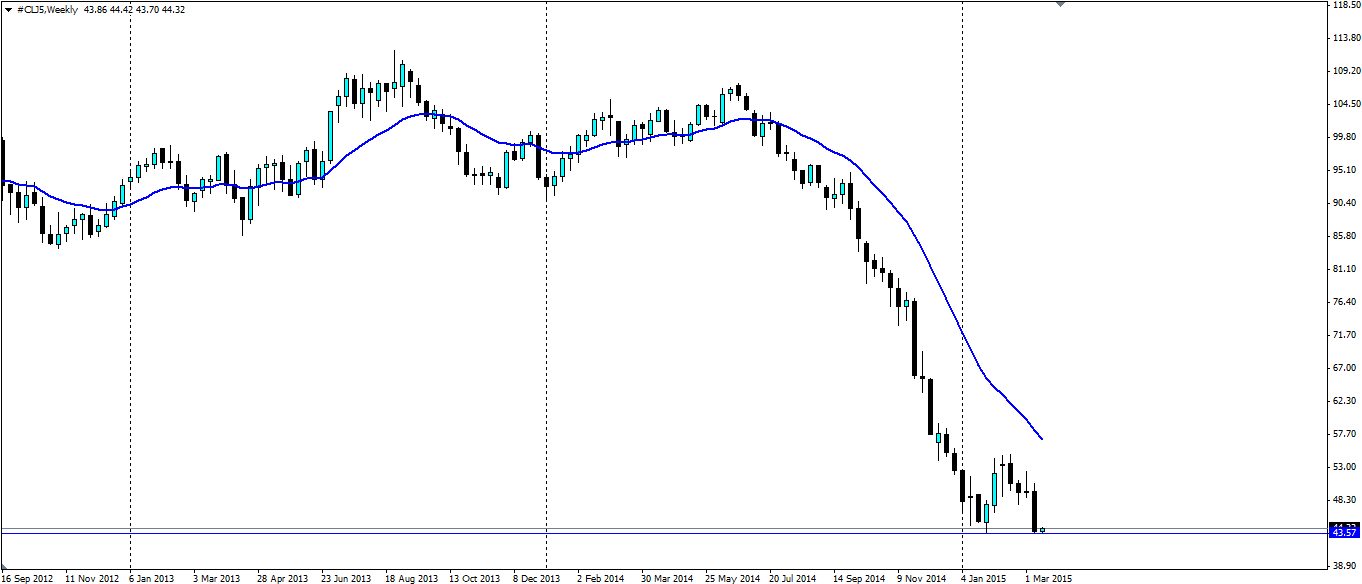
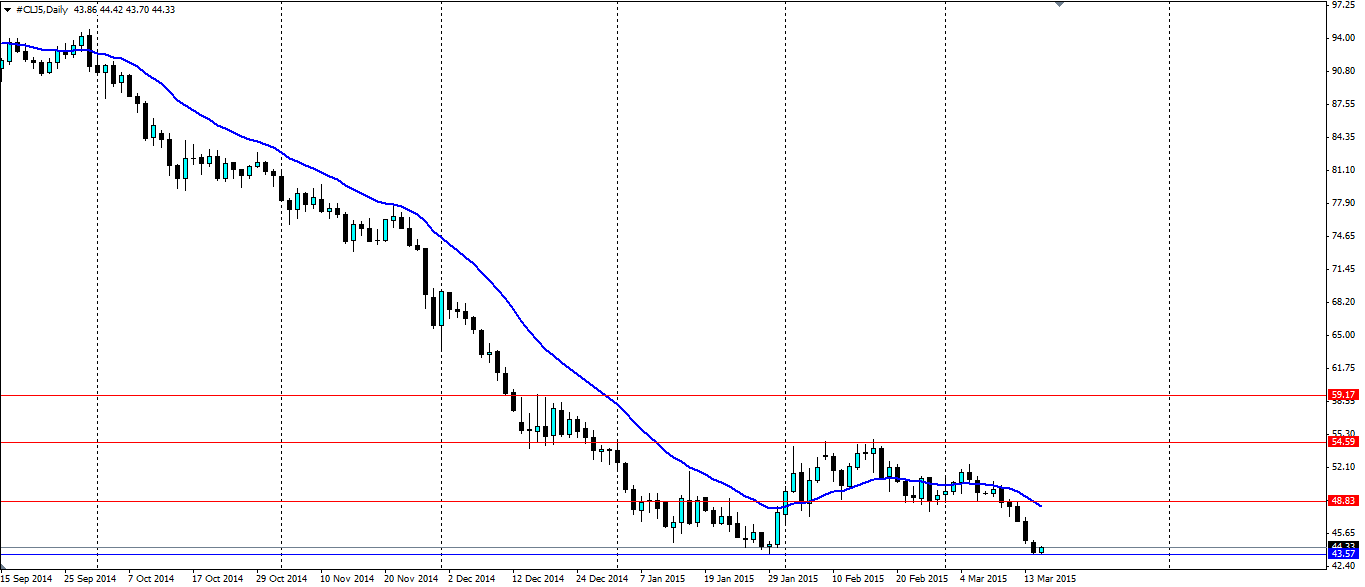
The oil markets were plenty active late last week as the short term support levels broke down. Could a large double bottom be forming on the weekly charts denoting a larger reversal structure that the market has been waiting on? Alternatively, could it be temporary support ahead of a larger shift lower?

Oil prices tumbled late in the week, down to the low seen in January at $43.57 a barrel. This came on the back of a report from the International Energy Agency (IEA) which showed production in the US expanded by 115,000 barrels a day. This has piled on the bearish sentiment as the market was hoping supply would contract with the falling prices.
Further adding bearish sentiment was news that storage facilities at Cushing were near to reaching capacity. If this happens, we may see a glut be forced onto the market, which will be detrimental to oil prices. Certainly the support at $43.57 a barrel would come under serious pressure.
The technical pattern of a double bottom could be forming at present as the support at $43.57 holds firm. There would have been plenty of buy orders at this level as it represents the low reached back in January. This structure will take many weeks to be confirmed, but any believers will be buying up with tight stop losses underneath the support. For some time the market has been talking about oil prices finding a bottom and this could be the beginning of it, but there is a long way to go.
The flipside is that this is merely a temporary halt in the continuation of the bearish trend. The most recent weekly candle on the above chart certainly looks impulsive and could carry a lot of momentum. If the support at $43.57 fails, there will be plenty of stop losses triggered (from all those buy orders above) that will add further momentum to the breakout.

Either way it plays out, Oil is at a critical point that will likely determine prices for the next 6 months. A breakout lower will look for targets at $39.48, $37.43 and $33.56 with $33.56 being the low found back in 2008 and likely to be a solid level. If the current support level holds, look for resistance at 48.83, 45.59 and 59.17.
The market is at a turning point with the possibility of a double bottom forming that could lead to a reversal of the bear trend. Alternatively a breakout will see a continuation of the trend which would target the 2008 lows.
