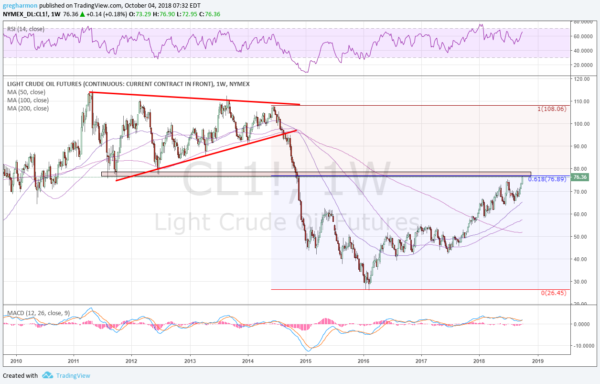
Wednesday Crude Oil moved to the highest price it has seen since November 2014. It is now over $76/ barrel and up nearly 300% since making a low at the beginning of 2016. Will this gusher to the upside continue? The chart below gives some clues.
The chart shows week oil prices since 2010. There was a long consolidation from 2011 into 2014, tightening in a triangle before the fall began. And when it did fall it fell fast. In six months it had been cut in half. First an drop to the triangle bottom then a push through and acceleration to the downside to a low at year end.
After a small bounce it continued lower to the ultimate bottom in 2016. It completed a bottoming Inverse Head and Shoulders pattern with a push higher later in that year, only to muddle along after triggering. It never fell back enough to negate the pattern and for the patient eventually found the path higher in June of 2017.
That brings us to today. Crude Oil has now achieved the price objective of the inverse Head and Shoulders at 76. It has also retraced 61.8% of the move lower that began in 2014. If even only for a minute, this would not be a surprising place for it to stop rising or top out. It is also just reaching the lowest point of that prior triangle.
Momentum continues to look strong though with the RSI rising and the MACD positive and crossing up. There is now some price history that may slow it down as it churns through, but it does not seem to be the time to get off the Crude oil rocket yet.
The information in this blog post represents my own opinions and does not contain a recommendation for any particular security or investment. I or my affiliates may hold positions or other interests in securities mentioned in the Blog, please see my Disclaimer page for my full disclaimer.

