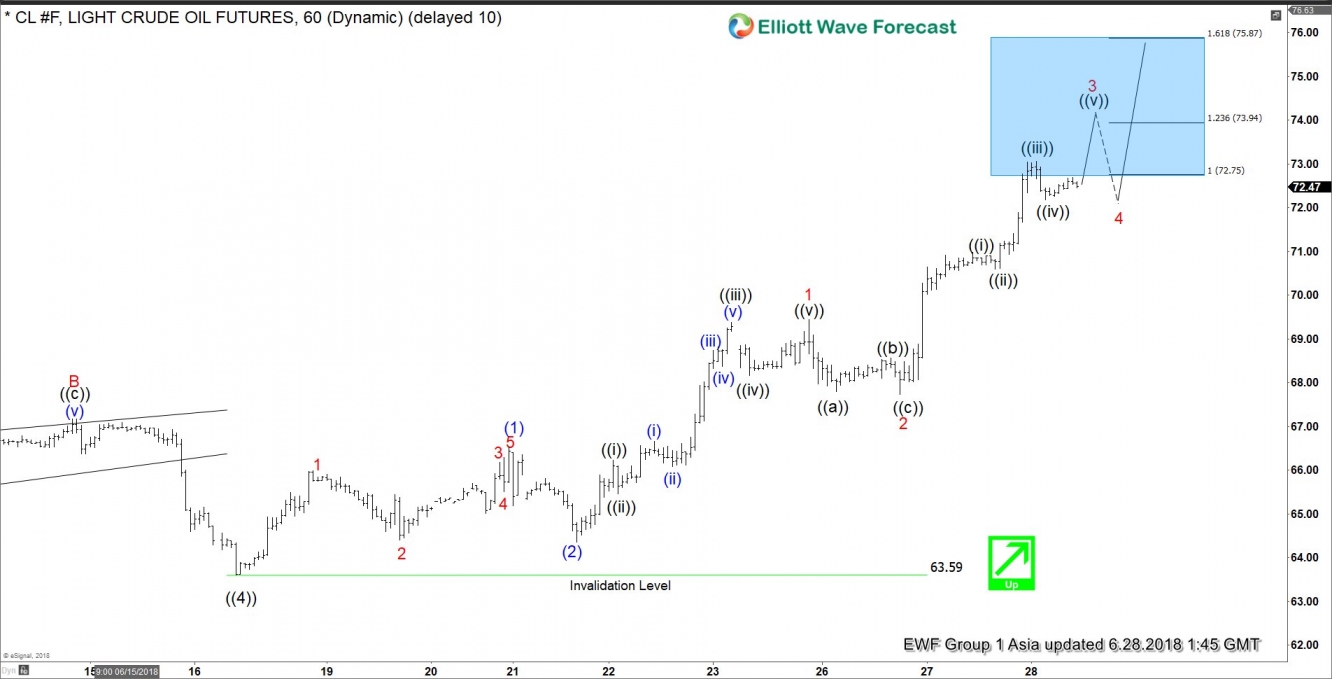
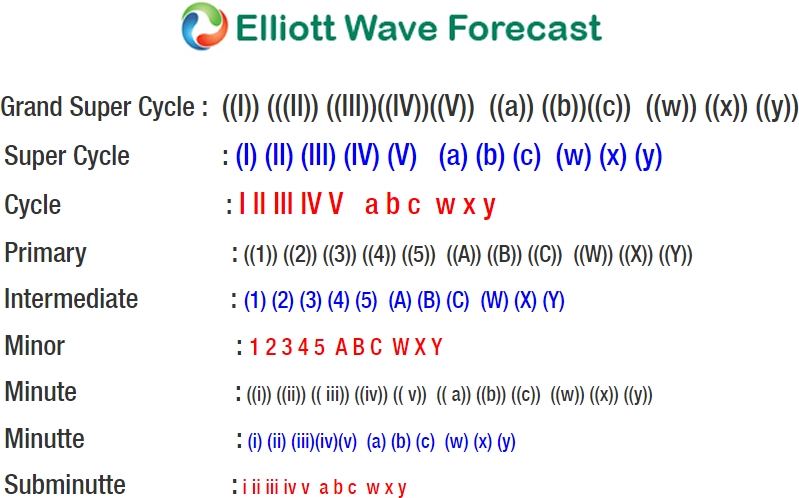
WTI Crude Oil short-term Elliott Wave view suggests that the decline to $63.59 on 6/18/2018 low ended primary wave ((4)) pullback. Above from there, the instrument has rallied to new highs already. And confirming the next extension higher taking place in primary wave ((5)). The rally higher from $63.59 low is taking the form of Elliott wave impulse structure with extension favoring more upside in the instrument.
Up from $63.59 low, the rally to $66.53 high ended intermediate wave (1) in lesser degree 5 waves structure. Down from there, intermediate wave (2) ended at $64.34 low. Then up from there, intermediate wave (3) remains in progress in another 5 waves structure within lesser degree cycles. And expected to show sub-division of 5 waves structure in each leg higher i.e Minor wave 1, 3 and 5. Above from $64.34 low, Minor wave 1 of (3) ended in 5 waves at $69.44. Minor wave 2 of (3) ended at 67.72 low. Minor wave 3 of (3) is expected to complete soon in-between 123.6%-161.8% Fibonacci extension area of Minor wave 1-2 at 72.75 – 73.94 area. Afterwards, the instrument is expected to do a pullback in Minor wave 4 of (3) before further upside extension is seen. We don’t like selling it into a proposed pullback.
OIL 1 Hour Elliott Wave Chart


