The markets are showing mixed signs at the start of the new week. On the one hand, European and US futures are pointing to a jump on the open as traders that weren’t prepared to hold risk over the weekend are prepared to enter the markets at the start of the week. However, the safe-haven dollar is also back in play recouping some of its steep losses from the previous week.
The mixed messages in the market come after herculean moves by central banks and governing authorities are underpinning risk sentiment, at the same time that governments are considering extending lockdown periods to protect the public from coronavirus. The numbers continue to escalate in Europe, the UK and the US, although the number of daily deaths in Italy has fallen for a second straight day, boosting optimism that the outbreak has peaked there.
Oil hits 18 year low
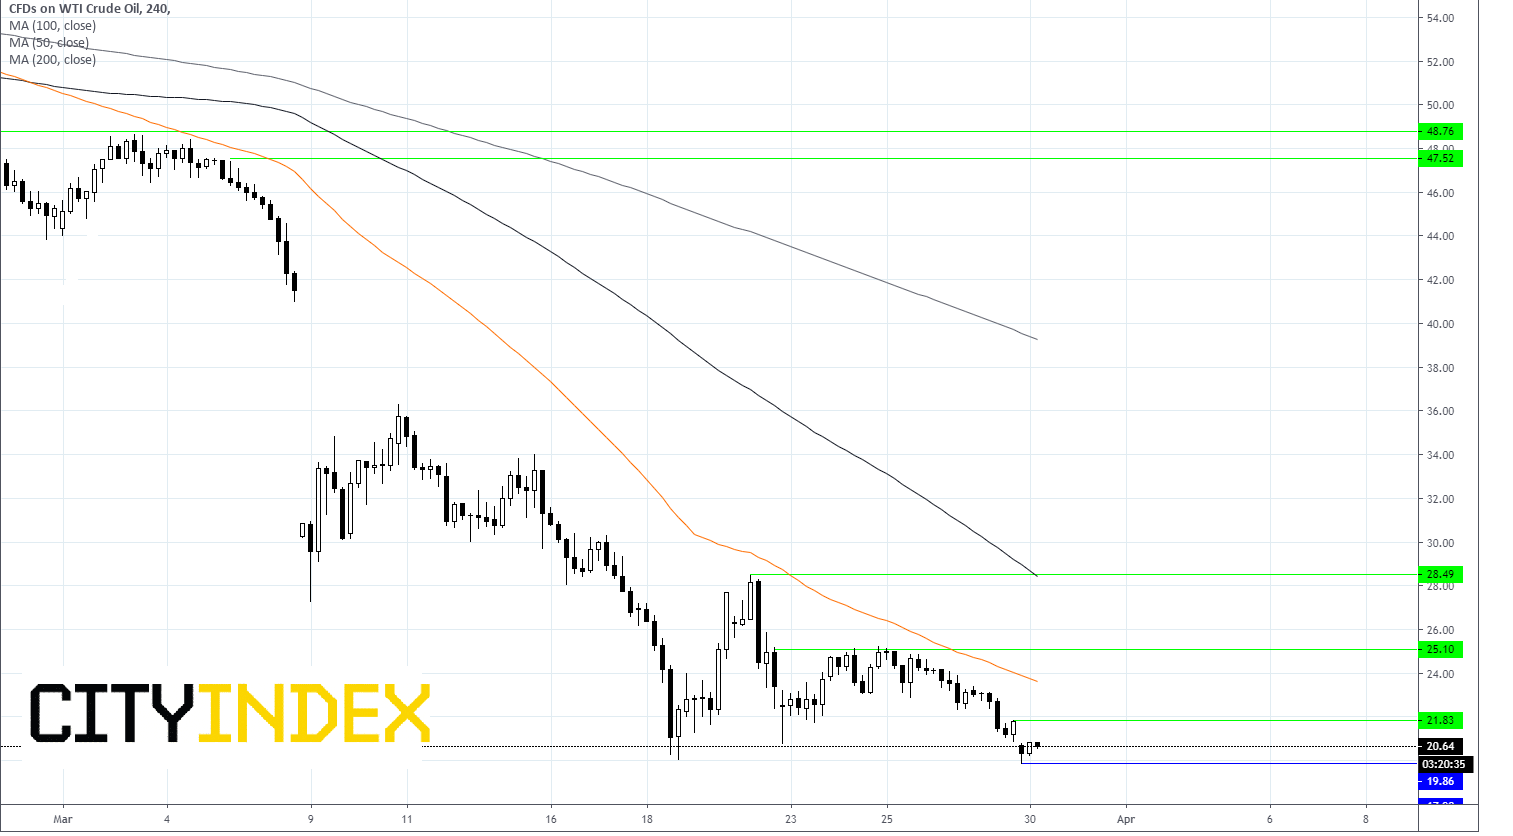
Oil has slipped below $20 per barrel overnight, losing 6%. WTI struck a nadir of $19.92 a barrel whilst Brent hit a low of $23, its lowest level since 2002. The sharp falls in oil come amid falling demand owing to coronavirus lockdowns and rising supply due to the Saudi Arabia Russia price war.
Demand shock
Oil has lost more than half its value over the past month as widespread lockdowns in Europe and North America has slashed oil demand. Around a quarter of normal global consumption could be lost. Expectations that lockdowns will be extended will keep the pressure on oil demand outlook.
Excess supply
Russia, the US and Saudi Arabia fighting for market shares have exasperated an excess supply situation. Excessive supply is only expected to improve as US shale production slumps in response to the collapsing prices. This will happen but it will take time.
Will oil recover soon?
The price of oil is unlikely to recover until either the lockdowns across Europe and the US show an end in sight, or excess supply dwindles. Given high inventory levels, this could be a while.
WTI levels to watch
Oil is trading over 6% lower at $20.45. It is below 50, 100 and 200 sma on 4 hour chart – a bearish chart.
Immediate support can be seen at $19.92 (today’s low) prior to $19 (round number) and $17.90 historic low (Feb ’02).
Immediate resistance is at $21.80 (today’s high) prior to $23.60 (50 sma) and $25.1 (high 20th, 24th and 25th March).

