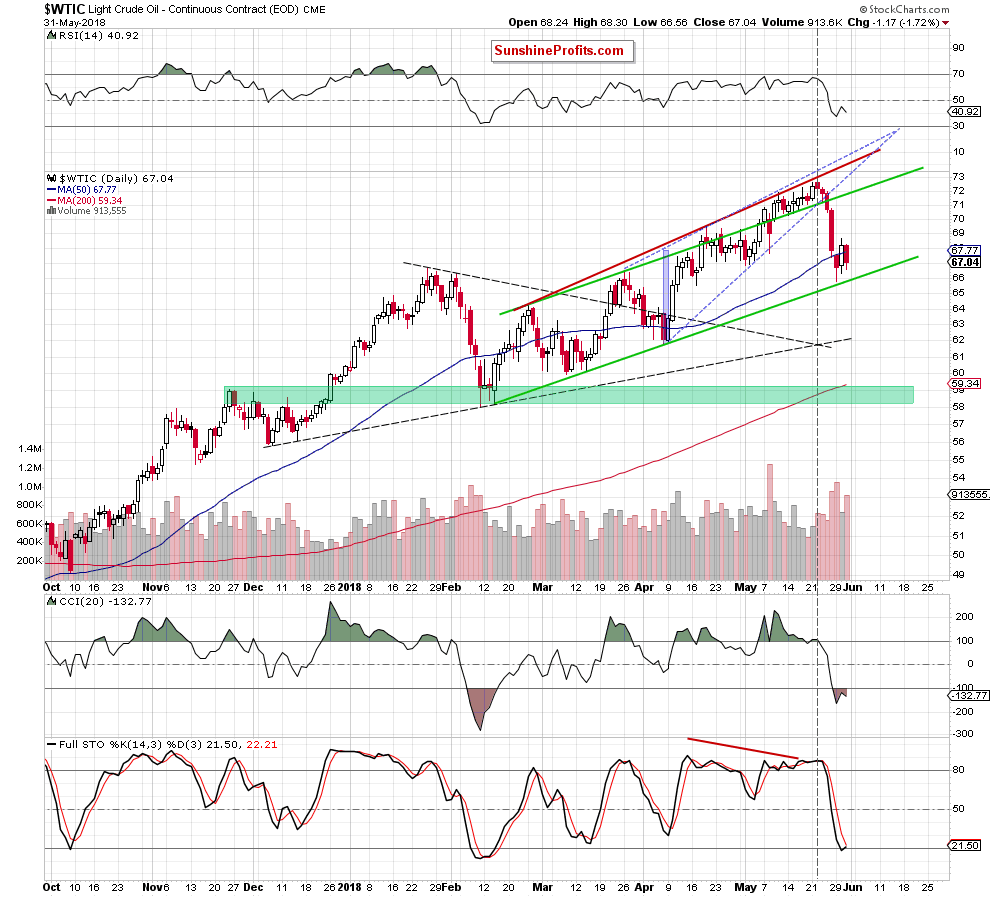
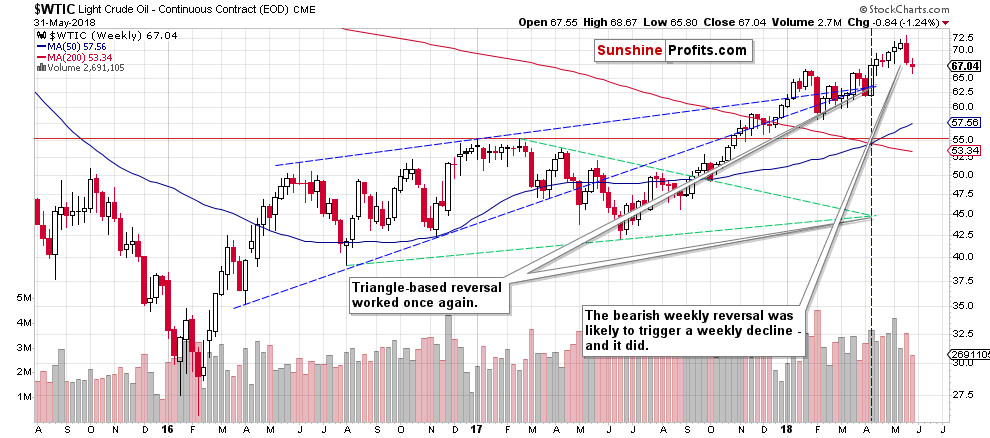
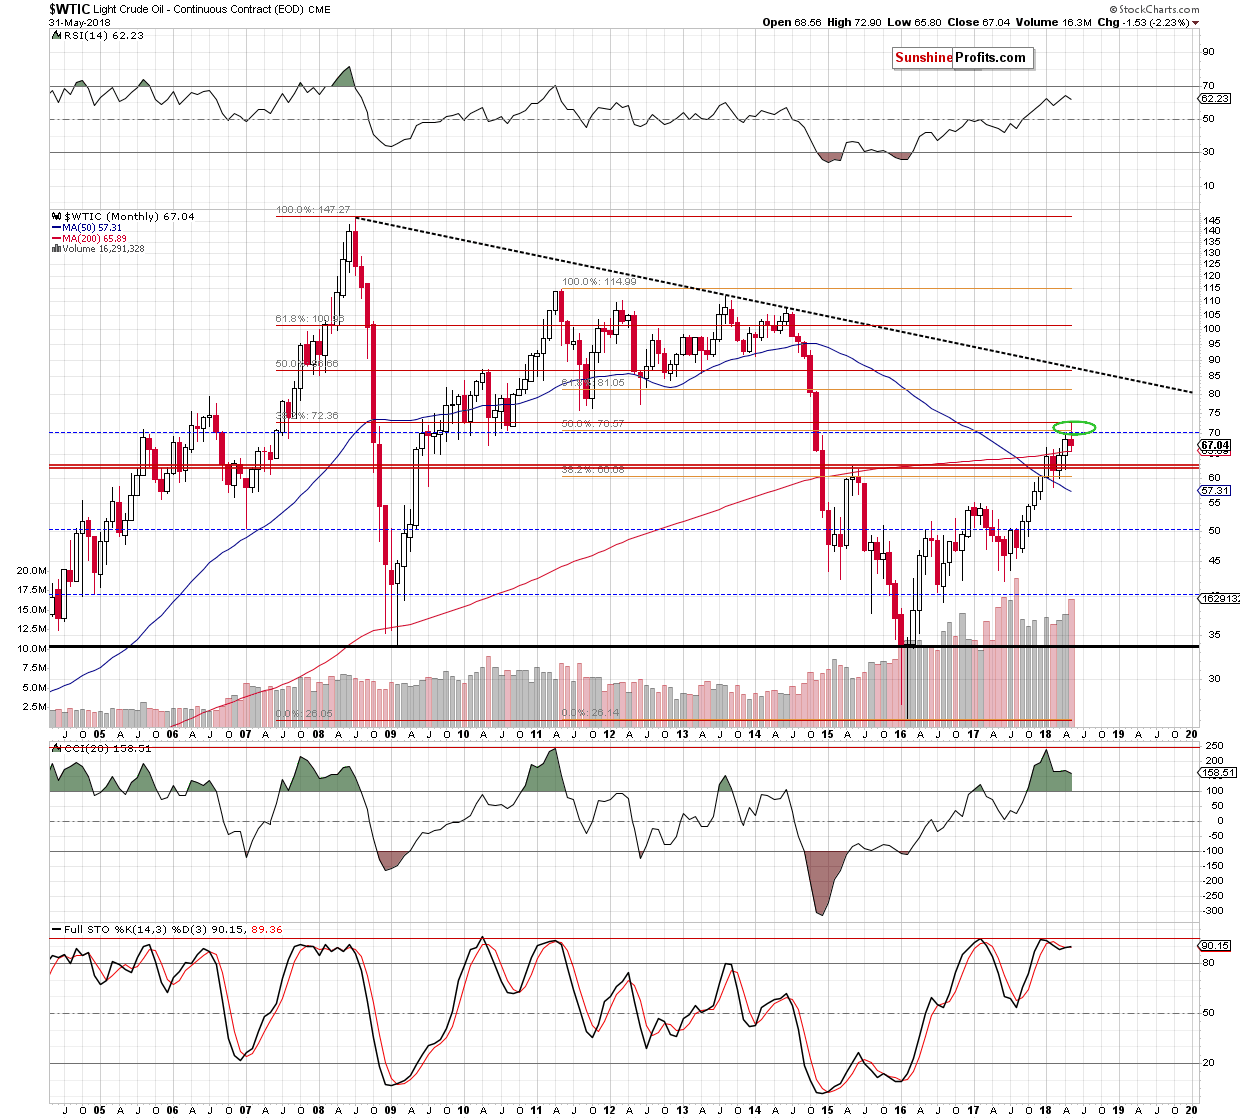
Wednesday’s rally that followed Tuesday’s reversal gave hope for a sustainable move higher. But only to those, who focus on the daily price movement only, without taking bigger picture into consideration. As we explained last Friday, there were bearish implications of the weekly candlestick pattern even before it was completed. In the following analyses we wrote the same about the monthly candlestick and since May is over, the candlestick is completed, and we can say that our previous expectations were met. What do the more long-term patterns indicate for the crude oil’s future and how much can we trust the recent rally?
We can’t. As we explained yesterday, crude oil’s recent upswing took place on low volume, which meant that it was just a pause, not a powerful rebound. Let’s take a closer look.

After several days of relatively low volume in mid-May, crude oil started to decline on increasing volume and finally plunged on huge volume. On Wednesday, crude oil moved a bit higher on volume that was much lower than what we had seen during the recent slide. That’s a classic example of how volume should behave during a pause.
There were fewer buyers and fewer sellers as both parties were waiting to see what happens and if crude oil managed to break below the support. The above seems neutral, until one considers that if there are no buyers or sellers, the price will not stay at the same level – it will decline.
Huge volume during a rally would indicate buyer’s strength, but what we saw suggests that we have the situation in which the market simply needed to take a breather before the move continues.
And it did and declined shortly thereafter. Moreover, yesterday’s decline took place on strong volume, which emphasizes the true nature of the move.
However, as we indicated earlier, the most important bearish indications come from weekly and monthly perspectives.

Crude oil was likely to move lower this week as the last week’s candlestick was a bearish reversal. Knowing this made one resistant to the bullish hype that Wednesday’s rally generated. If the week was likely to be in the red, what difference did it make if one of the sessions during the week ended higher?
The implications extend beyond the above, as they made a monthly bearish reversal very likely.

And we just saw one. It’s not a 100% classic book example as crude oil have erased some of the late-month declines, but it’s clear enough for the implications to be bearish. This is especially the case since the price of black gold reversed after reaching two important, long-term resistance levels: 50% Fibonacci retracement based on the 2011 – 2016 decline and (even more importantly) the 38.2% Fibonacci retracement based on the 2008 – 2016 decline.
Therefore, crude oil is likely to move lower not only in terms of days, but likely in terms of weeks, and perhaps even months.
Summing up, the outlook for the crude oil remains bearish and it seems that we’ll see even lower prices in the coming weeks despite this week’s small corrective upswing. In other words, it seems that the profits from the current short position will increase further.
