
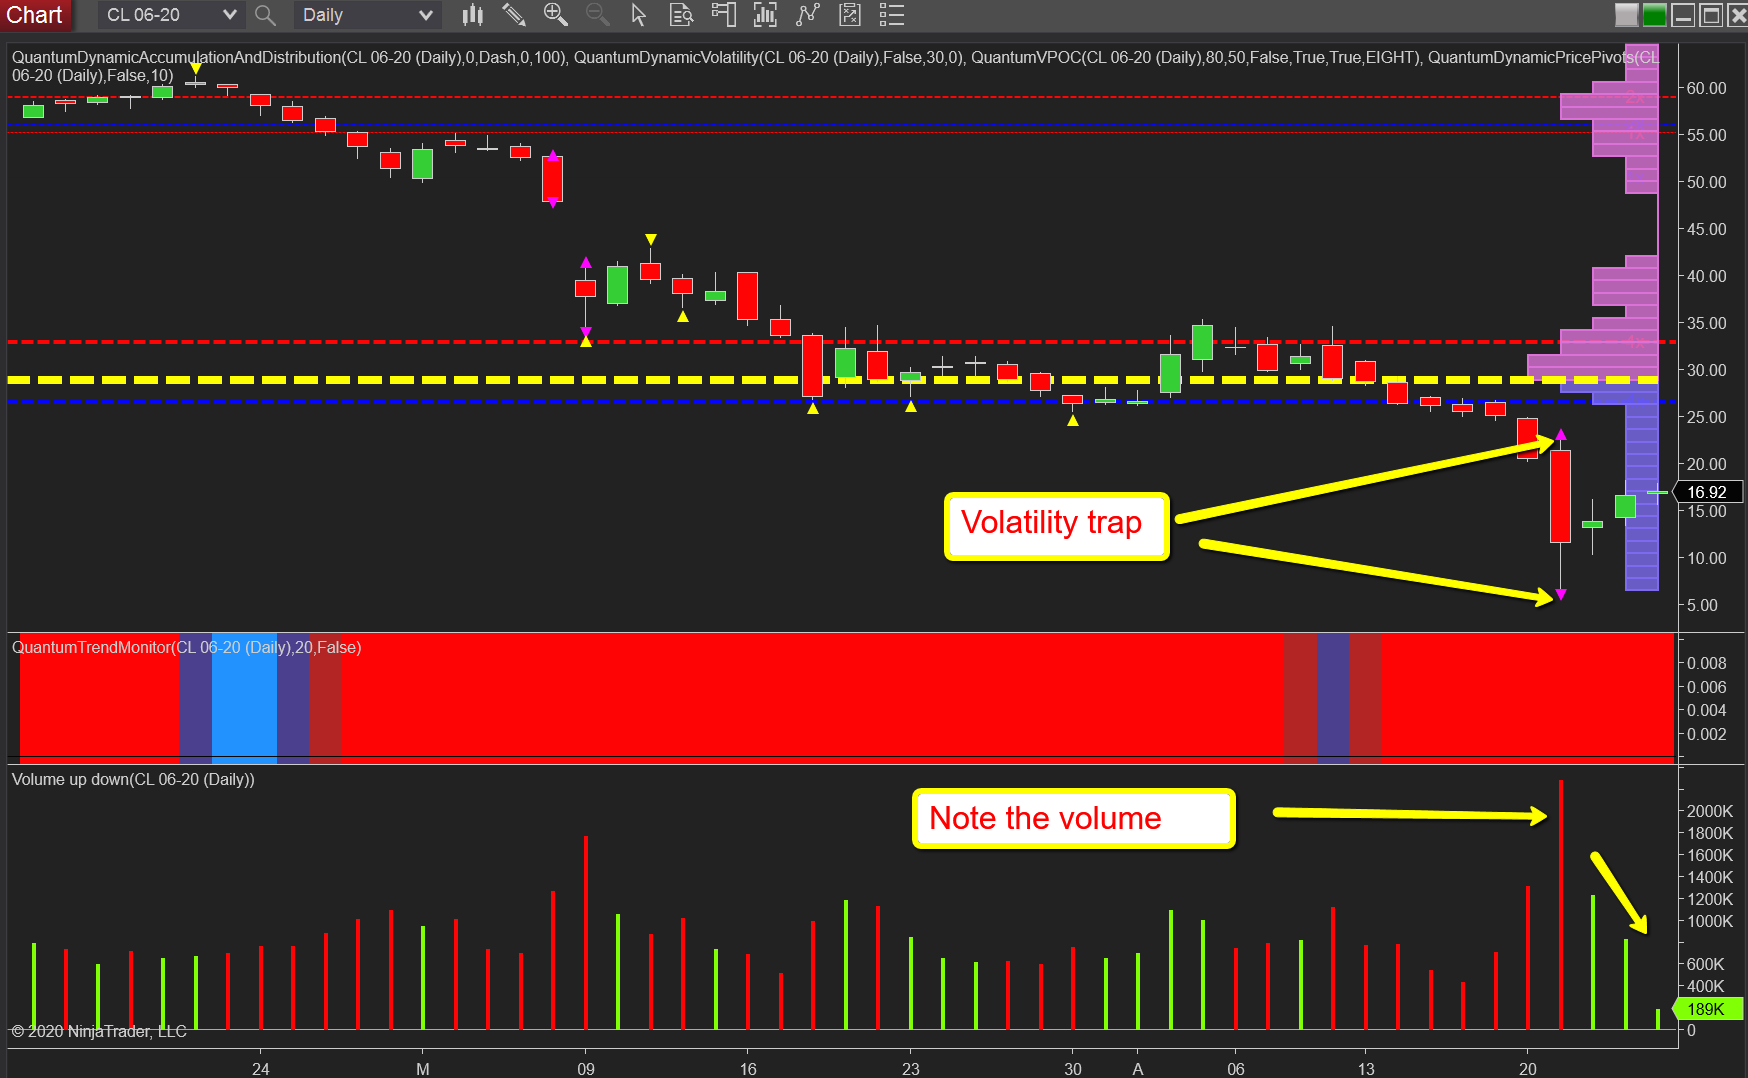
With all the recent headline news for oil, many have missed the trap on the daily chart for the WTI contract for June, which has been well and truly sprung following the dramatic price action on Tuesday. A dramatic trap saw the April contract move to negative prices while the forward contract sank to a low of $6.50 per barrel. However, it is the volatility trigger coupled with the extreme volume which signalled the reversal loud and clear for two reasons.
First, the indicator itself works on the average true range and is triggered when the price action has moved outside this range. It appears as a purple triangle above and below. For it to appear in the daily timeframe is unusual and, therefore, signals a dramatic move.
Second, when it does appear, we expect one of two things to follow. Either a reversal or congestion.
Finally, given the extreme volume associated with the candle and the depth of the wick to the lower body, this signals strong buying in amongst the heavy selling. Given the current uncertainty coupled with the lack of demand, we can expect to see oil trade within the spread of this candle for some time, if and until demand returns or supply agreements are reinstated. It was interesting to note yesterday’s effort to rally on falling volume from the previous day, and as such the current rally looks fragile.
Finally, note the trend monitor indicator which has maintained the bearish sentiment throughout, even through the congestion phase of earlier in the month.