🐂 Not all bull runs are created equal. November’s AI picks include 5 stocks up +20% eachUnlock Stocks

Oil And Gold Analysis: November 7, 2013

Published 11/07/2013, 04:12 AM
Updated 04/25/2018, 04:40 AM
GC
-

CL
Crude rebounded from the lowest level in five months before a report that may show U.S. fuel supplies shrank. Price declines the past week are probably excessive, according to a technical indicator. WTI has lost 5.4 percent in the past seven days. Its 14-day relative strength index yesterday fell to 25.9, the lowest reading since June 2012. Futures rebounded in April from about $86 a barrel when the chart indicator was most recently below 30.
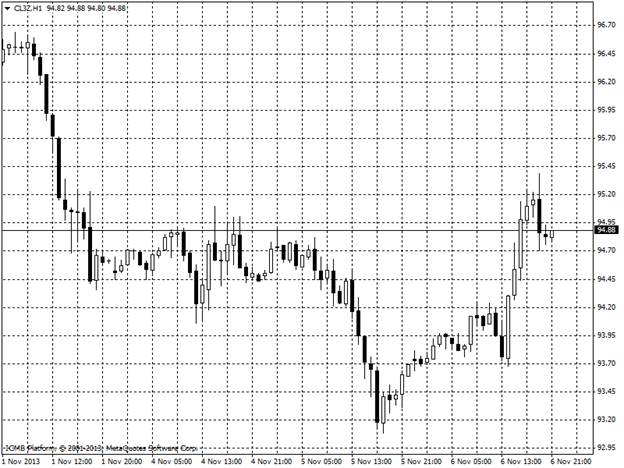
Oil Hour Chart

GOLD
Gold sales from Australia’s Perth Mint, which refines most of the bullion from the second-largest producer, rose in October as a drop in prices to a three-month low spurred demand and the mint filled a backlog of orders. Sales of coins and minted bars climbed 13 percent to 77,255 ounces last month from 68,488 ounces in September, according to data from the mint. While demand in October more than doubled from 30,430 ounces in August, sales were 31 percent lower than this year’s peak in April, when gold tumbled into a bear market.
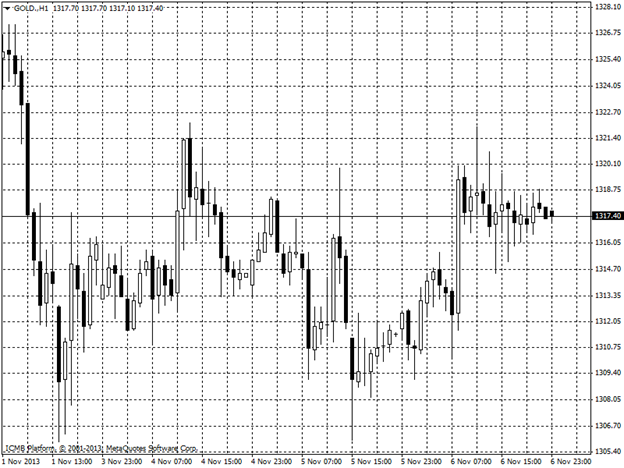
Gold Hour Chart

Latest comments

Loading next article…
Risk Disclosure: Trading in financial instruments and/or cryptocurrencies involves high risks including the risk of losing some, or all, of your investment amount, and may not be suitable for all investors. Prices of cryptocurrencies are extremely volatile and may be affected by external factors such as financial, regulatory or political events. Trading on margin increases the financial risks.
Before deciding to trade in financial instrument or cryptocurrencies you should be fully informed of the risks and costs associated with trading the financial markets, carefully consider your investment objectives, level of experience, and risk appetite, and seek professional advice where needed.
Fusion Media would like to remind you that the data contained in this website is not necessarily real-time nor accurate. The data and prices on the website are not necessarily provided by any market or exchange, but may be provided by market makers, and so prices may not be accurate and may differ from the actual price at any given market, meaning prices are indicative and not appropriate for trading purposes. Fusion Media and any provider of the data contained in this website will not accept liability for any loss or damage as a result of your trading, or your reliance on the information contained within this website.
It is prohibited to use, store, reproduce, display, modify, transmit or distribute the data contained in this website without the explicit prior written permission of Fusion Media and/or the data provider. All intellectual property rights are reserved by the providers and/or the exchange providing the data contained in this website.
Fusion Media may be compensated by the advertisers that appear on the website, based on your interaction with the advertisements or advertisers.
© 2007-2024 - Fusion Media Limited. All Rights Reserved.