Investing.com’s stocks of the week
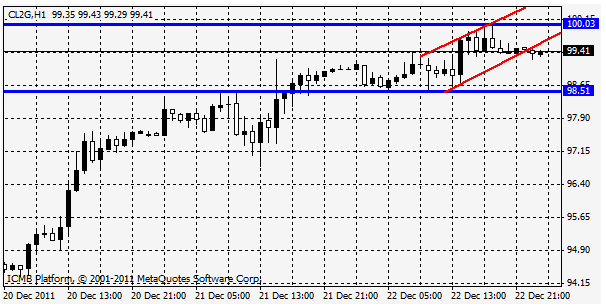
Oil rose to $100 for the first time in a week as the applications for unemployment benefits in the U.S. decreased to a three-year low and the index of U.S. leading indicators signaled that economic growth will accelerate. Futures advanced after reports that jobless claims dropped by 4,000 to 364,000 last week and leading indicators climbed more than forecast in November. U.S. oil supplies fell the most in a decade last week. Crude oil for February delivery rose $1.17, or 1.2 percent, to $99.84 a barrel at 12:39 p.m. on the New York Mercantile Exchange after climbing to $100 for the first time since Dec. 14. Prices have increased 9.3 percent this year after climbing 15 percent in 2010. U.S. crude oil stockpiles fell 10.6 million barrels last week, the largest decrease since February 2001. Imports dropped to 7.58 million barrels a day, the lowest level since September 2008. Oil touched $100.03 before dropping back and it was in line with analyst forecast. Another reason why oil is up 26% this quarter as the continues seeking of support from European union and the U.S to Middle East and Asian countries to join imposing sanctions against Iran, the second-biggest producer in the Organization of Petroleum Exporting Countries. EU nations, the U.S. and Asia-Pacific allies discussed possible measures and vowed to increase pressure on Iran to abandon a suspected nuclear weapons program. Iran’s navy will hold 10 days of maneuvers east of the Strait of Hormuz citing Navy Commander Habibollah Sayari. About 15.5 million barrels of oil a day flows through the waterway between Iran and Oman at the mouth of the Persian Gulf.

GOLD
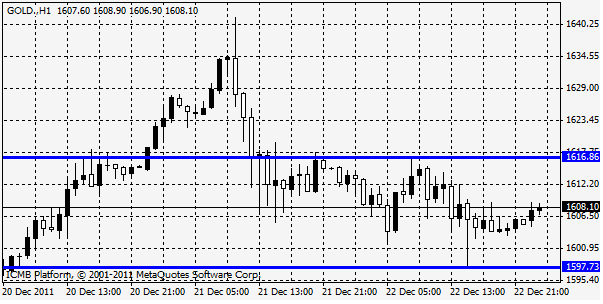
Gold declined in New York for the third time in four days on signs of a strengthening U.S. job market and a drop in holdings by exchange-traded fund investors. Applications for unemployment benefits unexpectedly dropped last week to the lowest since April 2008. The jobless numbers were better than expected, and we’re seeing the dollar strengthen again. Holdings in bullion-backed ETFs fell for a fifth day to the lowest level since Nov. 16, as investors sold the metal to cover losses in other markets. Gold futures for February delivery fell 0.2 percent to settle at $1,610.60 an ounce at 1:49 p.m. on the Comex in New York. The metal has climbed 13 percent this year. Prices dropped 6.9 percent last week after the Federal Reserve refrained from taking new action to boost economic growth. The precious metals are seeing some consolidation, some tepid bargain-hunting buying, some short covering and some position-squaring-selling as the year winds down. That is making for trading action that is choppy and lackluster. Look for the precious metals and most other markets to experience quieter, low-volume trading until after the holidays. February gold last traded down $5.00 at $1,608.60 an ounce. Spot gold last traded down $7.90 an ounce at $1,607.50.

