Oil's close below $50 maintains its sharp decline to lower targets. This decline that originated from a breakdown from cause in 2014 and embraced as a beneficial 'tax cut' for consumers in western economies by many. The tax cut logic proposes that decline oil price will promote economic growth for consumption-driven economies.
This one-dimensional perspective assumes other expenses are not rising as fast as oil, gasoline, heating oil, and natural gas are falling. If the cost of education, insurance, taxation (the cost of socialism), etc, equals or exceeds energy savings, discretionary incomes, a driver of future economic growth in consumption driven economies, would contract.
Smart money, ever skeptical of easy interpretations, recognize that the collapse is more of a byproduct of a global economic contraction than a beneficial tax cut. While a large number of bulls continue whistling pass the graveyard to allay their fears, they drowning out the muffled sounds of implosions from the periphery economies (1,2,3,4)
The professional investors must profit by anticipating future trends and events rather than chasing old news. This is done by following the invisible hand or message of the market. That message, the simultaneous study of the the cycle of accumulation and distribution (trend), the distribution, movement, and participation of leverage (leverage), time/cycles, and human behavior that excludes opinions is defined below:
Trend
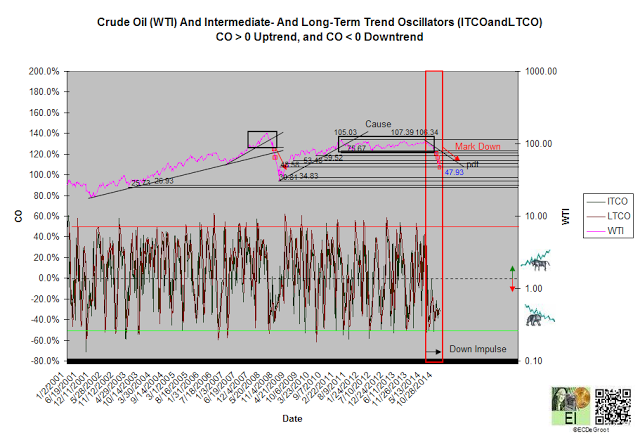
Crude oil's trend oscillators¹ generated a bearish crossover in July 2014. This technical breakdown triggered an aggressive down impulse that's smashed through layers of ice (support) with ease. Last week's clean break of 48.58 introduces 34.83 and 30.81 as the new downside targets.
WTI needs to close 53.48 to transition the trend from mark down to cause. Cause marks the accumulation of energy necessary to reverse the trend. Expectations of a speedy return of the bull; therefore, ignore the realities of the accumulation and distribution cycle. These interpretations must be considered biased and should be ignored.
Leverage
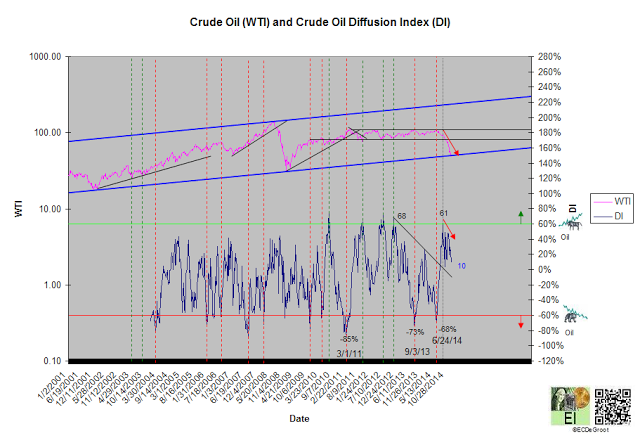
Crude oil's DI reading of 10%, a sizable downtick as price declined, suggests strong distribution² (chart 2). This observation is consistent with a bear phase³ or an inverted bull phase; both are bearish.
Either way, downticks into price declines are extremely bearish. This association warns bulls to stay away until DI displays upticks and closes above 60%. These conditions, an indication of accumulation, are necessary to support at least a countertrend rally.
Time/Cycles
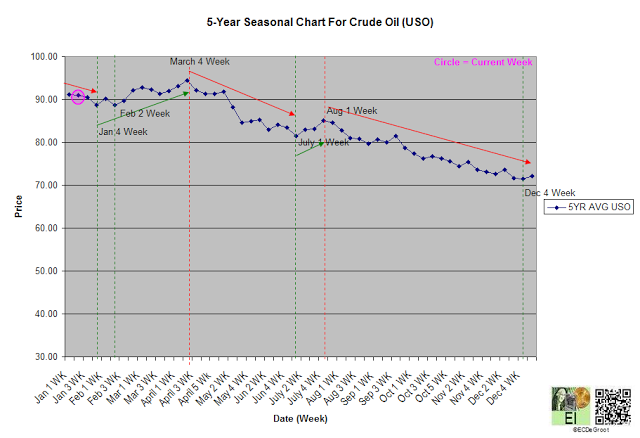
The 5-year path of least resistance remains down until late January or mid February (chart 3). This is a logic time frame for a countertrend rally or short-covering bounce. The failure to produce one by the spring of 2015 will be interpreted as sign of weakness by the bears. This would support continuation of the mark throughout much of 2015.
¹ The intermediate-term close oscillator (ITCO) and long-term close oscillator (LTCO) define a market's trend oscillators and impulse wave. For example, when both trend oscillators are positive and negative, they define up and down impulse waves, respectively. Mix readings, such as a positive ITCO and a negative LTCO, suggest a market transitioning up to down, and vice versa.
² The relationship between DI and price defines accumulation and distribution. Positive (direct) and negative (inverse) relationships as price rallies indicate accumulation and distribution accumulation, respectively. Positive (direct) and negative (inverse) relationships as price declines indicate distribution and accumulation, respectively. In general, bulls purchase accumulation and sell and/or reduce risk into distribution. Bears sell distribution and/or reduce risk into accumulation.
³ Bull and bear phases are defined as positive to negative and negative to positive diffusion index (DI) oscillations.


