PBOC fixes USD/CNY above 6.90
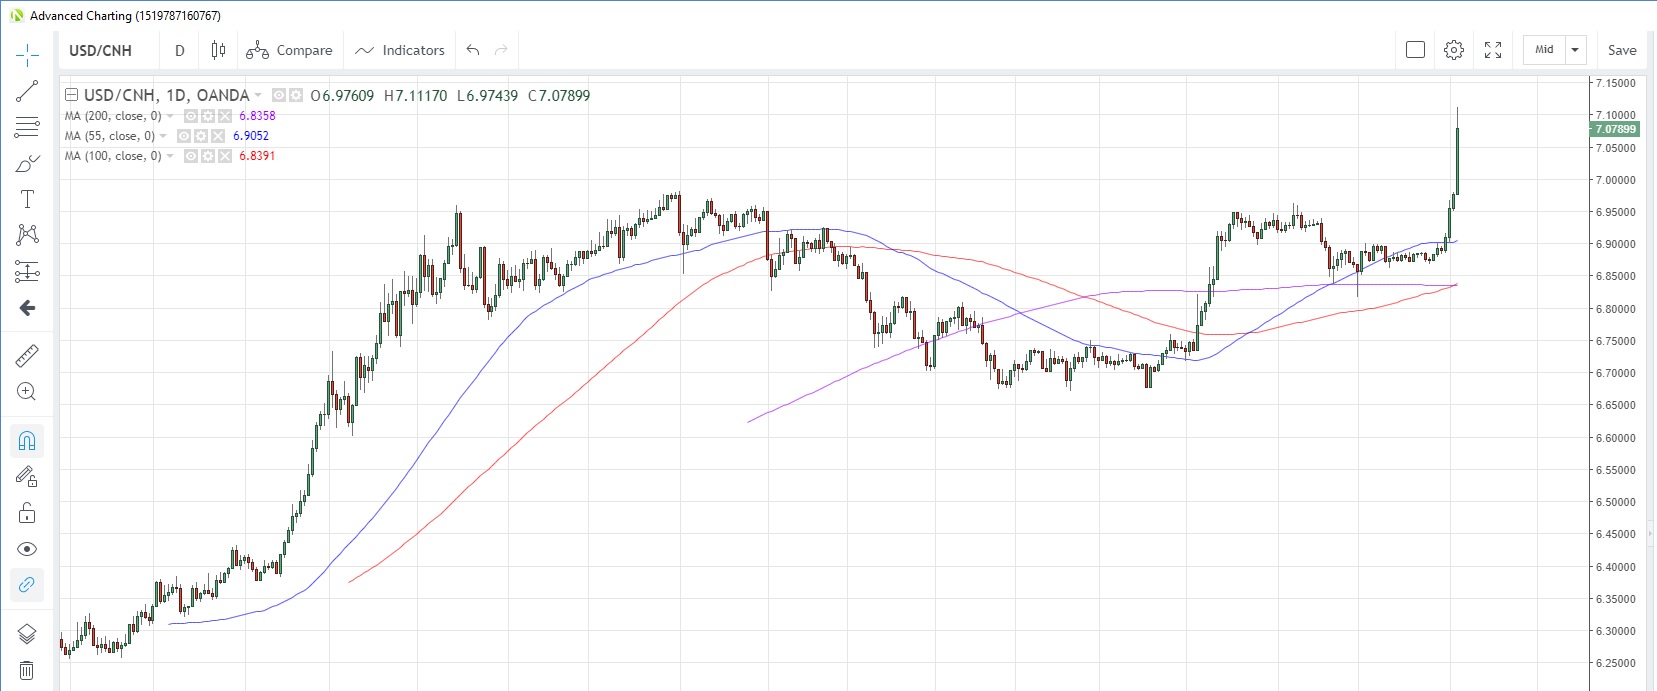
USD/CNH tore above the 7.00 for the first time (according to OANDA records) after the Peoples Bank of China fixed the onshore yuan at 6.9225 versus the US dollar, the weakest yuan fix since December 3. USD/CNH had opened at 6.9760 but zoomed to an intra-day high of 7.1120 after the fixing, the highest level on record.
In a later comment, the central bank said that the yuan’s depreciation past 7.0 to the dollar was due to tariff expectations and protectionism. Its FX policy stance would not change due to the move through 7.0, adding that the 7.0 level is not irreversible. It also said that the FX market could find its balance on its own, and was confident in its own ability to maintain the yuan at a reasonable, stable level, but it would crack down on short-term yuan speculation and anchor market expectations.
USD/CNH Daily Chart

Aussie suffers knock-on effect of yuan weakness
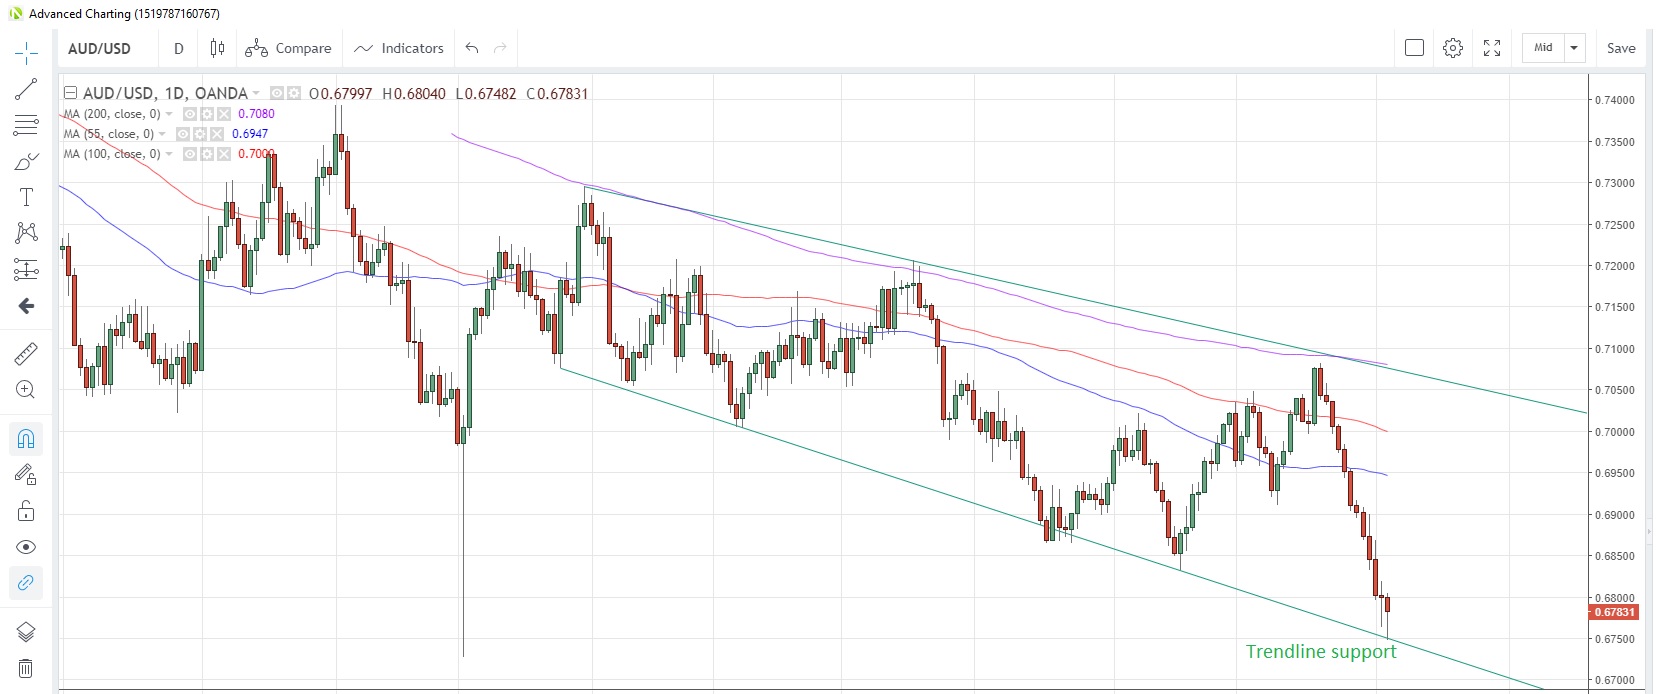
The Australian dollar weakened 0.75% versus the US dollar to hit the lowest level since the January 3 mini crash, testing trendline support around the 0.6750 level. Losses against the Japanese yen were more pronounced, with the AUD/JPY rate tumbling 1.48% to 71.40, also the lowest level since January 3.
The Aussie felt additional pressure from a weaker-than-expected China services PMI from Markit, which slid to 51.6 in July, the weakest reading in five months, and contrary to economists’ expectations of an improvement to 52.9.
AUD/USD Daily Chart

Trade woes pressure indices
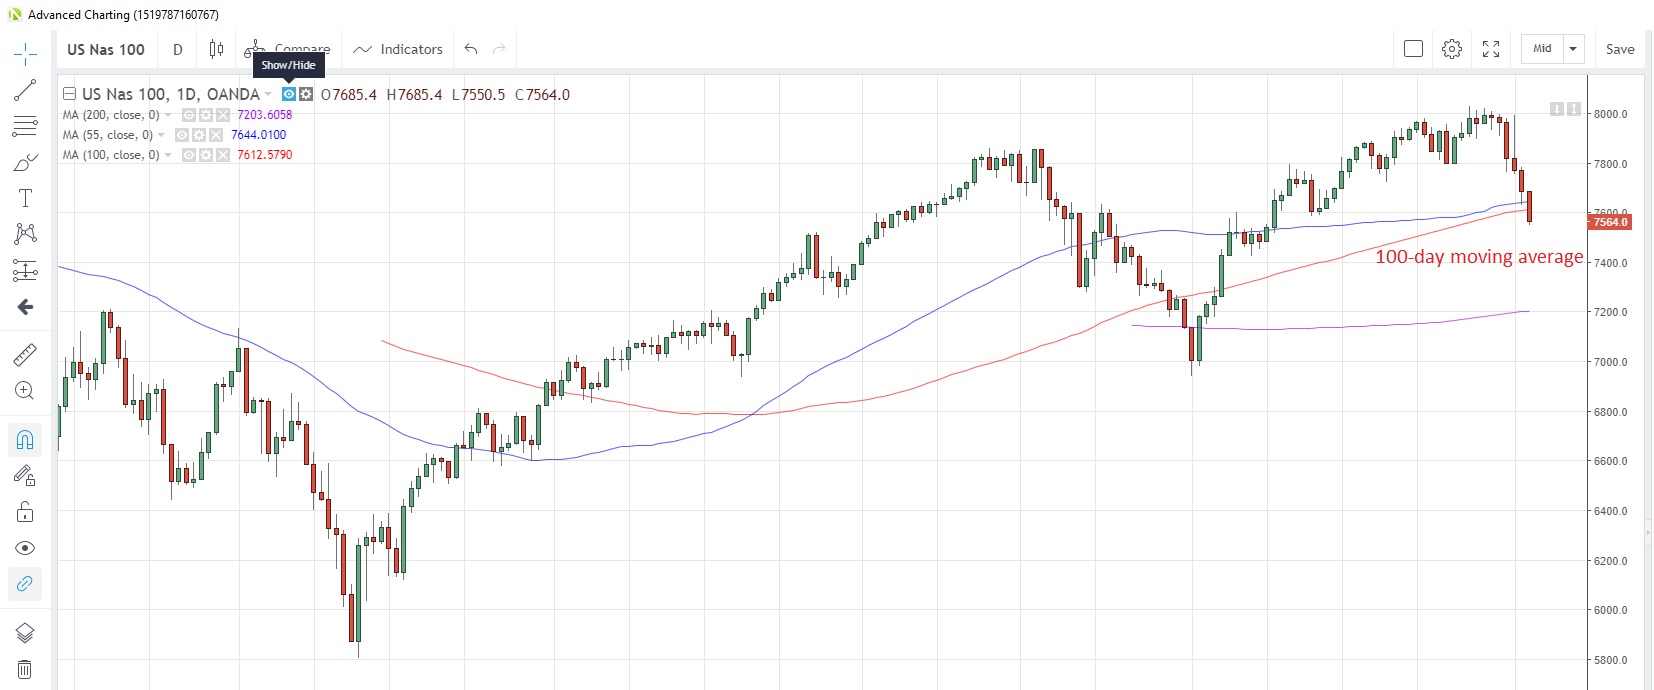
It was a sea of red across most equity indices this morning, with the HongKong33 index the major under-performer. US indices fell between 0.94% and 1.36%, with the latter pushing the NAS100 index through the 100-day moving average at 7,612 for the first time since June 7. The drop in China shares was marginal, even after reports that China has asked state-run purchasers to stop US agriculture imports. No doubt this came as a reaction to Trump’s threat toward the end of last week of additional 10% tariffs on $300 billion worth of Chinese imports.
NAS100 Daily Chart

Hong Kong paralyzed by strike
Another weekend of anti-government protests is being exacerbated by protester’ plans to bring central areas to a grinding halt with a one-day strike. Already hundreds of flights have been cancelled from the region’s airport. Hong Kong’s Chief Executive Carrie Lam stated that the protesters were pushing Hong Kong to an “extremely dangerous situation”, with some protesters challenging China’s sovereignty.
Separately, Hong Kong’s Financial Secretary said the economy faces downward pressure, which will affect livelihoods. The final reading for Hong Kong’s Q2 GDP data is due on August 16, with prior estimates suggesting the economy expanded 0.6% y/y, the weakest growth rate since Q3 2009.
Services PMIs on tap
Today is a day of service sector PMIs, with the final Markit readings for Germany, the Euro-zone and the UK seen unchanged at 55.4, 53.3 and 50.2 respectively, according to the latest surveys of economists. The US reading is also seen unchanged but the ISM equivalent is expected to improve to 55.5 from 55.1.
