The analytics company Axioma Inc. has released its Risk Review for the first quarter of 2012. The review, prepared by Axioma’s Senior Director, Applied Research, Melissa Brown, and Director, Applied Research, Scott Hamilton, describes the first quarter as one of strength for markets around the globe.
Separately, Axioma and NASDAQ OMX have together announced a new index family (the NASDAQ Axioma Equity-Commodity Index Series) that will help portfolio managers gain exposure to the spot prices of commodities through the equity markets. There are three indexes in this series: one centered on oil, one on gold, and the third on agricultural commodities.
At a recent breakfast in their Manhattan offices, Axioma executives explained the creation of new indexes with the analogy of an onion. An asset manager might have been quite contentedly earning alpha for his clients and fees for himself with a certain quantitative strategy – such as, perhaps, trading on the stock of companies that mine or market gold or that are otherwise sensitive to that commodity’s price. But any quantitative strategy is susceptible to being reduced to an index, and along with this, to transparency and routine. Once this happens, that “alpha” becomes “beta,” and the 2 + 20 fees are no longer available.
A manager in search of alpha will have to move beyond that strategy, peeling away that layer of the onion and going to a deeper, not-yet-indexable, strategy. No doubt both the metaphrand and the metaphier in this image have produced their share of tears.
The Risk Review
“Compared with the end of the first quarter,” Brown and Hamilton write, “risk fell substantially for most of the benchmarks we track, although risk remained higher in most cases than it was a year ago.”
This was especially true for the U.S. market. The Russell 1000 was up nearly 13 percent during the period, with sharp decreases in both asset and factor level volatility.
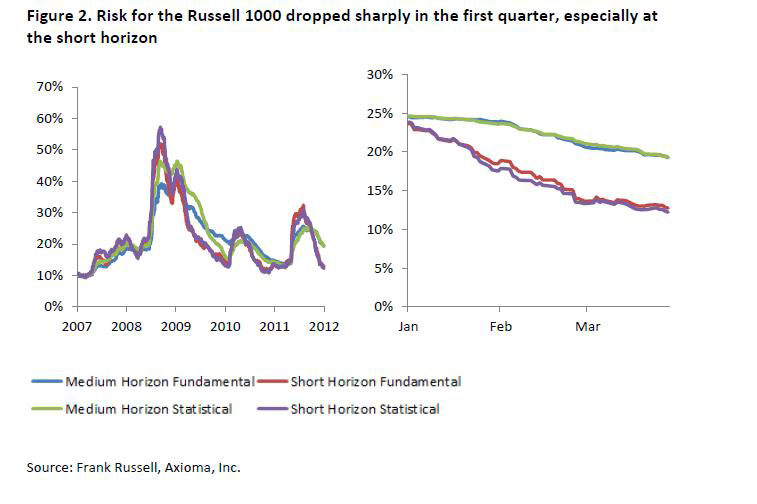
Axioma uses four distinct risk models, distinguished by both temporal ambition and method: medium horizon fundamental; medium horizon statistical, short horizon fundamental and short horizon statistical. You can see in the left-side of the graph below (Figure 2 in the US portion of the Q1 review) that risk as measured by these four metrics has risen and fallen together with reasonable concord throughout the period since 2007.
At the peak of the global financial crisis in late 2008, there was a wide (20 point) gap between the most pessimistic (high-risk) of the four readings and the most optimistic (short horizon stat and medium horizon fundie, respectively.) Still, even there, the lines had risen and would soon drop in unison.
At the end of the fourth quarter, 2011, Axioma’s analysts had noted (as they remind us in the new report), that the four risk models were in especially close agreement, and they speculated that this meant that they, and the rest of us, were unlikely to see a near term ‘risk surprise.’
But as you can also see on the right-hand side of the graph above, the four models have diverged considerably in the course of the first quarter 2012. More strictly, they have fallen into two groups. The two medium-term models are in accord with one another and the two short-term models likewise. The medium term models are more pessimistic than the two short-term models, even though for all four models the direction of movement is down.
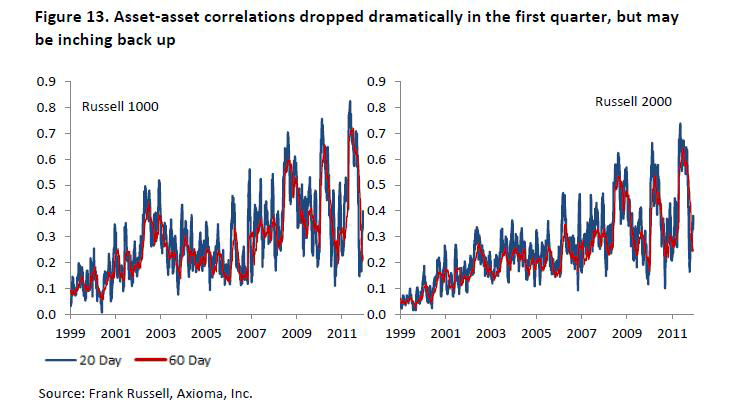
It isn’t clear what this means, but a related bit of good news for portfolio managers, who presumably want access to relatively uncorrelated assets, is that asset-asset correlations decreased markedly in the first quarter.
Specifically, the report notes that the median 60-day correlation among Russell 1000 stocks “fell to 0.22 on March 30, 2012 from 0.61 on December 30, 2011, and ended the quarter not far off its historical low.”
Year to Year
In year-to-year terms, the Russell 1000 was 4.5 percent more volatile in 1Q 2012 than it had been in 1Q 2011
Although the details are different in Europe, the broad picture looks much the same. In Europe, as in the U.S., there was an overall decline of risk in 2012 1Q, and this decline shows up through all four metrics. In Europe, too, the first quarter has seen a widening of the difference between the medium term and the short term models, in which the medium term models see a significantly greater level of risk.
Year-to-year, Europe’s FTSE was 3.3 percent more volatile in 1Q 2012 than in 1Q 2011.
China and Japan both stand out. In quarter-to-quarter terms, China was the only world market to show a (slight) increase in volatilities in its equities benchmark in 1Q 2012.
China and Japan were the only two markets to see a decrease in volatility year-to-year.
In Japan, the first quarter of 2011 was a rather special case given the earthquake and tsunami. The ground beneath the country showed unwelcome volatility. China’s outlier status, in both quarter-to-quarter and year-to-year terms, is more tricky to explain.
- English (UK)
- English (India)
- English (Canada)
- English (Australia)
- English (South Africa)
- English (Philippines)
- English (Nigeria)
- Deutsch
- Español (España)
- Español (México)
- Français
- Italiano
- Nederlands
- Português (Portugal)
- Polski
- Português (Brasil)
- Русский
- Türkçe
- العربية
- Ελληνικά
- Svenska
- Suomi
- עברית
- 日本語
- 한국어
- 简体中文
- 繁體中文
- Bahasa Indonesia
- Bahasa Melayu
- ไทย
- Tiếng Việt
- हिंदी
Of Falling Risks And Indexes
Published 05/02/2012, 03:17 AM
Updated 07/09/2023, 06:31 AM
Of Falling Risks And Indexes
Latest comments
Loading next article…
Install Our App
Risk Disclosure: Trading in financial instruments and/or cryptocurrencies involves high risks including the risk of losing some, or all, of your investment amount, and may not be suitable for all investors. Prices of cryptocurrencies are extremely volatile and may be affected by external factors such as financial, regulatory or political events. Trading on margin increases the financial risks.
Before deciding to trade in financial instrument or cryptocurrencies you should be fully informed of the risks and costs associated with trading the financial markets, carefully consider your investment objectives, level of experience, and risk appetite, and seek professional advice where needed.
Fusion Media would like to remind you that the data contained in this website is not necessarily real-time nor accurate. The data and prices on the website are not necessarily provided by any market or exchange, but may be provided by market makers, and so prices may not be accurate and may differ from the actual price at any given market, meaning prices are indicative and not appropriate for trading purposes. Fusion Media and any provider of the data contained in this website will not accept liability for any loss or damage as a result of your trading, or your reliance on the information contained within this website.
It is prohibited to use, store, reproduce, display, modify, transmit or distribute the data contained in this website without the explicit prior written permission of Fusion Media and/or the data provider. All intellectual property rights are reserved by the providers and/or the exchange providing the data contained in this website.
Fusion Media may be compensated by the advertisers that appear on the website, based on your interaction with the advertisements or advertisers.
© 2007-2025 - Fusion Media Limited. All Rights Reserved.
