Ode To Joy (Global)

Published 06/16/2016, 12:25 PM
Updated 05/14/2017, 06:45 AM
JOY
-

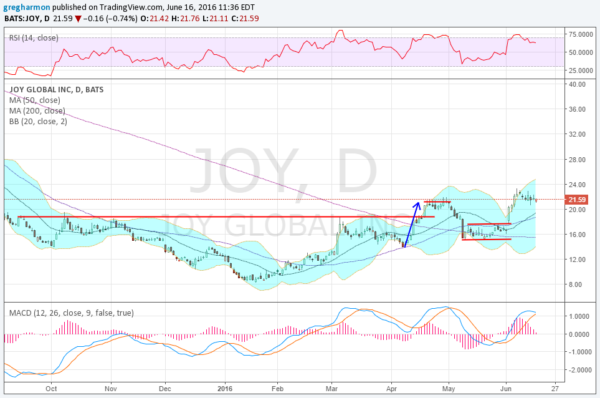
Joy Global’s (NYSE:JOY) stock price fell from a high over $64 in the 3rd quarter of 2014 to a low below $9 in January this year. If anybody needs a pick me up, it's JOY's shareholders. But it looks like the stock is on track to pull out of this downturn and continue higher. The chart below tells the story.

After a long bottoming process from September 2015 until mid April this year, the stock broke higher, making its first higher high. Smiles turned to frowns though as the breakout failed and the stock moved back lower. The consolidation over the course of May, though, established a higher low. And then the breakout to start June took the stock price to another higher high. An uptrend is emerging.

Joy Global

The pull back since that higher high, in a bull flag, sets up for yet another leg higher. A break to the upside gives a target to 27.50 from the current low point of the flag. Momentum indicators are holding strong in the bullish zone as it digests the latest move up. The RSI is over 60 and running sideways while the MACD is rolling flat. Even the Bollinger Bands® have opened higher to allow a move up. Look for a break of the flag higher, maybe over 22.75 to confirm the next leg up using the low of the flag as a stop.

Latest comments

Loading next article…
Risk Disclosure: Trading in financial instruments and/or cryptocurrencies involves high risks including the risk of losing some, or all, of your investment amount, and may not be suitable for all investors. Prices of cryptocurrencies are extremely volatile and may be affected by external factors such as financial, regulatory or political events. Trading on margin increases the financial risks.
Before deciding to trade in financial instrument or cryptocurrencies you should be fully informed of the risks and costs associated with trading the financial markets, carefully consider your investment objectives, level of experience, and risk appetite, and seek professional advice where needed.
Fusion Media would like to remind you that the data contained in this website is not necessarily real-time nor accurate. The data and prices on the website are not necessarily provided by any market or exchange, but may be provided by market makers, and so prices may not be accurate and may differ from the actual price at any given market, meaning prices are indicative and not appropriate for trading purposes. Fusion Media and any provider of the data contained in this website will not accept liability for any loss or damage as a result of your trading, or your reliance on the information contained within this website.
It is prohibited to use, store, reproduce, display, modify, transmit or distribute the data contained in this website without the explicit prior written permission of Fusion Media and/or the data provider. All intellectual property rights are reserved by the providers and/or the exchange providing the data contained in this website.
Fusion Media may be compensated by the advertisers that appear on the website, based on your interaction with the advertisements or advertisers.
© 2007-2025 - Fusion Media Limited. All Rights Reserved.