Key Points:
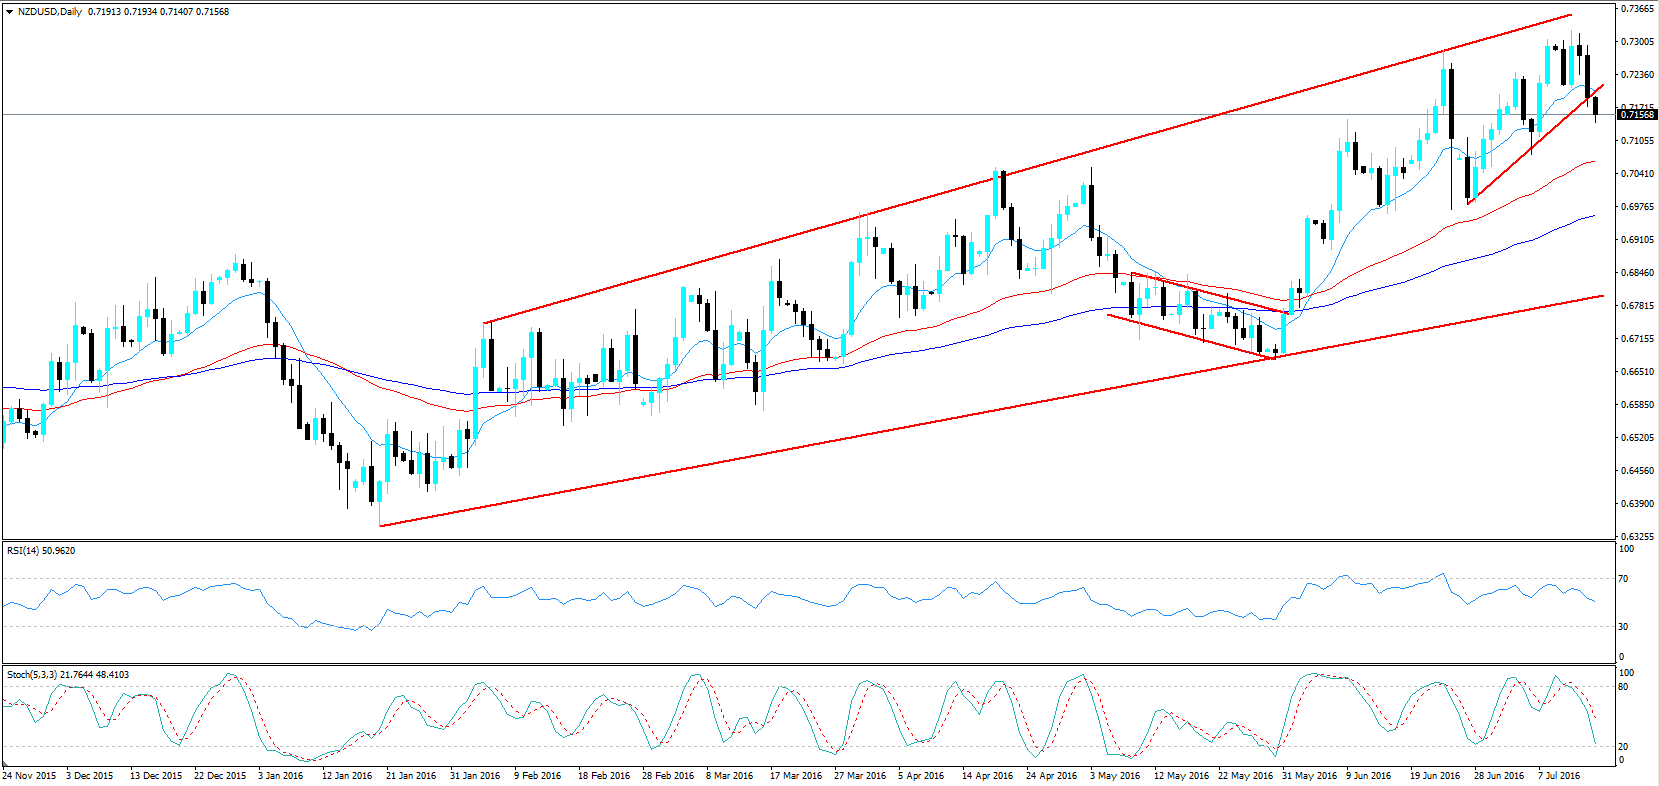
- Price action slips below rising wedge pattern.
- Weekly CCI indicating pullback in progress.
- RSI Oscillator trending lower within neutral territory.
The kiwi dollar has been relatively resurgent over the past month following the formation of a corrective structure in late May. However, despite the venerable pair catching a bid, the kiwi dollar has now reached the top of the channel and is setting up to break to the downside.
In fact, a cursory examination of the daily chart shows the current rising wedge pattern towards the top of the channel with price action breaking down over night. Subsequently, the close below the short term trend line has predisposed the pair to a pullback towards the bottom of the channel.
In addition, the RSI Oscillator has turned the corner and is now trending steadily lower which is also largely mirrored within stochastics.
Also, viewing the pair on a weekly timeframe shows the NZD/USD has failed to surmount the relatively strong resistance just around the 73 cent handle. In fact, on a weekly timeframe, the CCI is also within the reversal zone and has started trending lower.

Subsequently, on the medium time frame, the pair is likely facing a fairly concerted retracement towards the bottom of the channel around the 0.6790 mark. However, there are quite a few areas of support between its current level and that target in extension. In particular, the 0.6975 mark is a more probable turning point when considering a mean reversion view.
The kiwi dollar is largely facing a crossroads given its current historical high valuation and the need for the RBNZ to depreciate the currency to stimulate New Zealand export demand.
Ultimately, a corrective decline is likely in the coming days but any move below the current channel could bring about a sharp depreciation in an impulse wave. Subsequently, expect a short term move back towards the 70 cent handle but be aware that the channel’s validity could be in question in the coming weeks.
