Investing.com’s stocks of the week
Key Points:
- Elliot wave is moving into its final bullish leg.
- Rough bearish bat forming for the pair.
- Watch out for unexpected moves by the US Fed and the RBNZ.
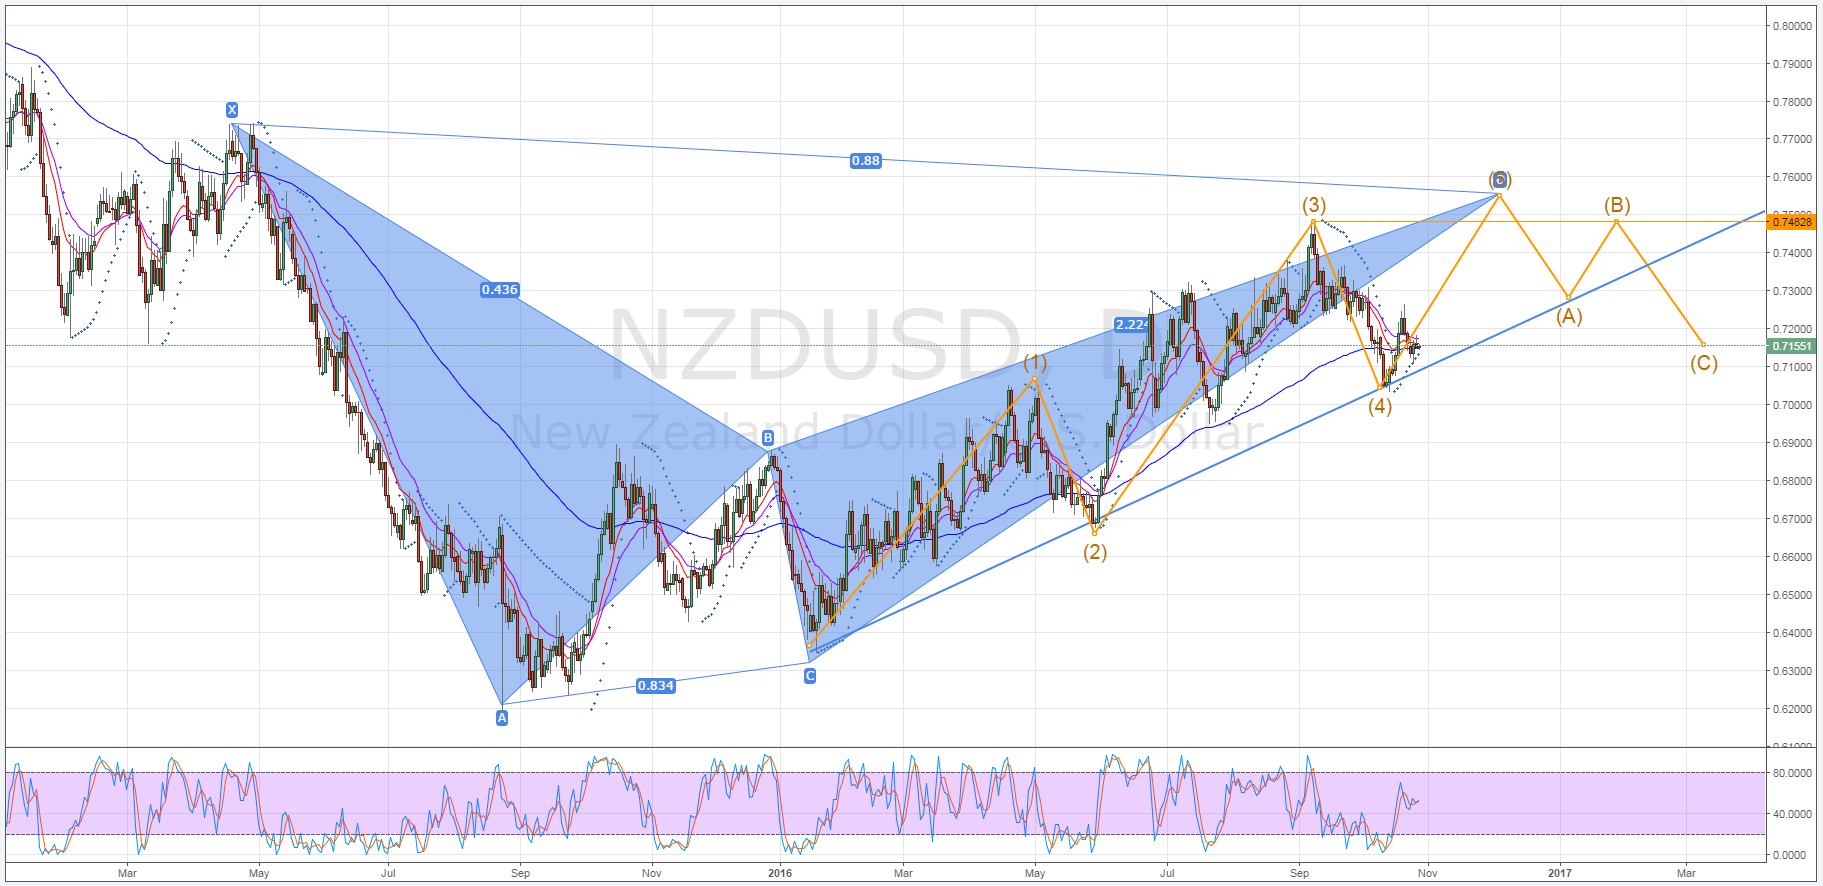
Despite its recent bearishness, the kiwi dollar could be setting itself up for a rather sizable long-term rally. Specifically, a confluence of technical events is seemingly pointing to a medium to long-term uptrend that could see the NZD back challenging or even above the 0.75 handle come December. However, the likelihood of a Fed FFR increase in December could throw a spanner in the works, as could a surprise November hike.
First and foremost, any potential long-term bullishness is primarily the result of the presence of an Elliot wave. Having just completed leg four, the fifth and final leg is already underway and appears to be moving in line with what we would expect to see from this pattern. Furthermore, confirming the switch in momentum is the daily Parabolic SAR reading which is now firmly bullish. However, this is not the only chart pattern indicative of another period of gains for the kiwi dollar.

Whilst somewhat messy, the NZD looks as though it is forming a bearish bat pattern which should see it move up above the 0.75 handle by early December at its current trajectory. What’s more, looking at the weekly charts reveals that EMA activity is on the verge of moving into a strong bullish configuration. Combined with the Elliot wave and the Parabolic SAR readings, these two technical indicators should see buying pressure mount significantly as we move forward.
As is typical of Elliot waves and bearish bat chart patterns, we expect to see the kiwi dollar make a move back to the downside after reaching the end of the two structures. Specifically, the pair should initially decline to test the long-term upward trend line prior to retracing higher and subsequently plunging through this line in an ABC corrective wave.
However, whilst we can be fairly certain that the pair will need to move into decline, just where this corrective wave will end is somewhat uncertain. This being said, a historical zone of support does exist around the 0.7154 level and ending the C leg here would result in a symmetrical ABC pattern.
Ultimately, much of this forecast relies on the Fed meeting expectations over the coming months. A surprise rate hike in November could see the NZD/USD breakout below the long-term trend line prematurely and disrupt the move up to the 0.75 handle.
Furthermore, the RBNZ could likewise impact the pair’s ascent if they provide a deeper cut to the OCR than the usual 25bps. As a result, monitor the central banks moving ahead to avoid being caught out by any unwelcome surprises.
