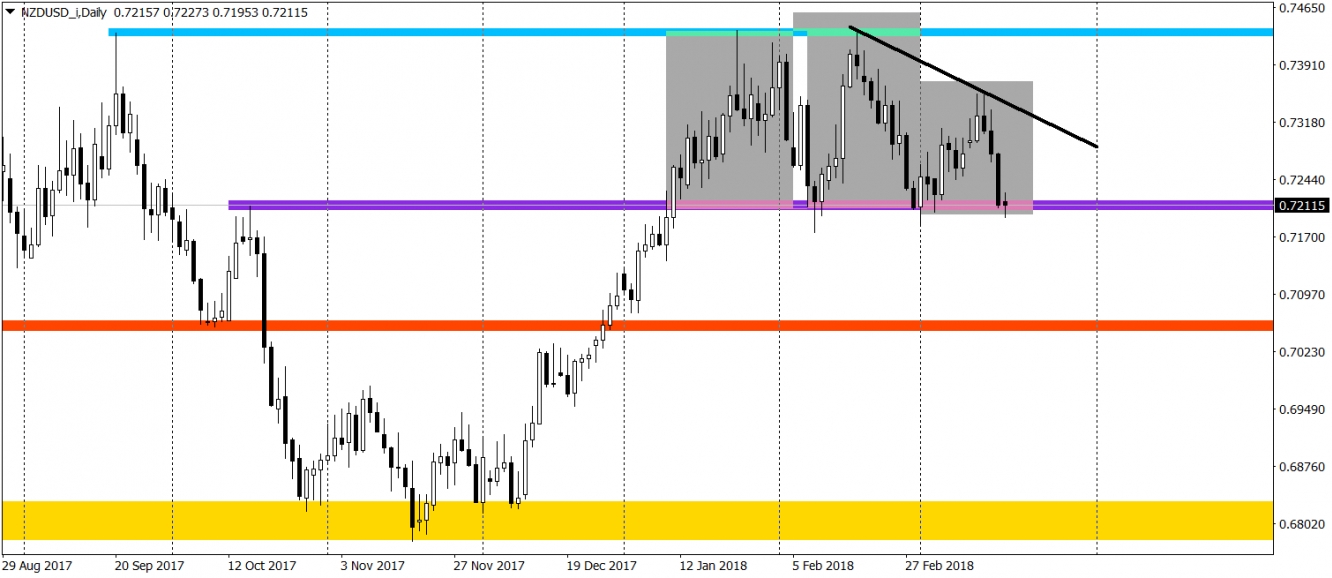
On many instruments with the USD, we can currently spot the Head and Shoulders patterns (or iH&S). It is for example happening on the USD/CHF or the Dollar Index istelf. In this analysis, we will look closer on the NZD/USD, where we have the H&S but the price is still above the neckline.
As mentioned, the price is still above the neckline but the breakout is right behind the corner. The price tries to get below this support as we speak. In this case, NZD/USD closing a day below the purple area (neckline), will be a major sell signal. As for the potential targets, we do have a 0.706 (red). That area was an important resistance in March and April 2017 and a support in October. From the current levels, we do have 140 pips there, which makes it a nice mid-term trading opportunity. But remember, from the technical point of view, the sell signal will only be created once the price will close below the purple area, not before that.
Negative sentiment will be denied, once the price will break the black line connecting the top of the head with the top of the right shoulder. That would totally deny the H&S pattern and open us a way towards the resistance around the 0.743 (light blue).

