Key Highlights
· New Zealand dollar traded higher recently against the Japanese yen to test the 82.60-70 resistance area.
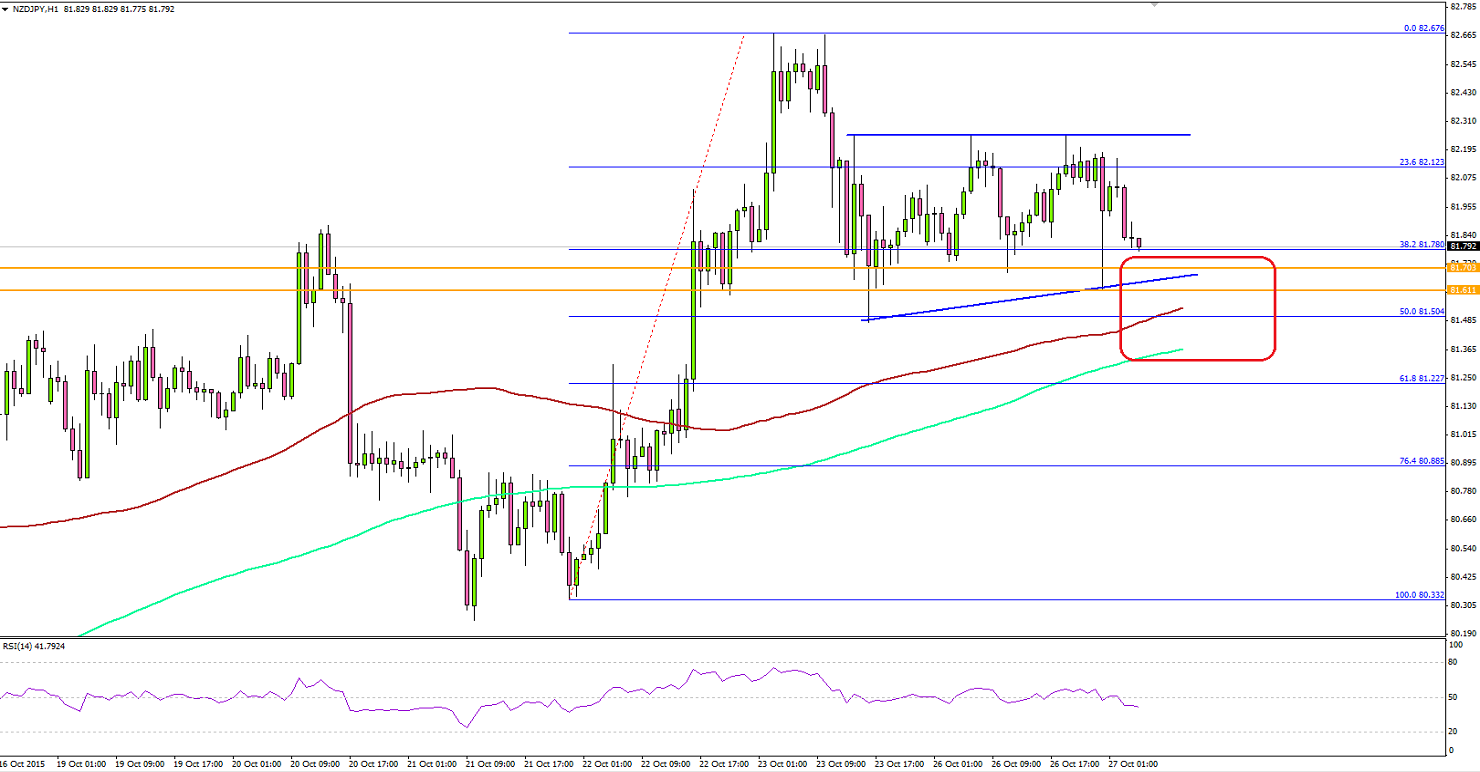
· The NZD/JPY pair is currently correcting lower and testing a major support area around 81.60.
· New Zealand Trade Balance data was released by the Statistics New Zealand today, which came in at $-1,222M, compared with the forecast of a $-800M trade deficit in September 2015.
· In terms of the yearly change, the trade balance came in at $-3.200B.
NZD/JPY Technical Analysis
The New Zealand dollar managed to climb higher against the Japanese yen, and traded close to the 82.60-70 resistance area. Sellers appeared around the stated area and ignited a downside reaction.

Currently, there is a triangle pattern formed on the hourly chart that might act as a catalyst for a break in the near term. On the downside, there is a monster support building around 81.60. The triangle support area, the 100 hourly simple moving average and the 50% Fib retracement level of the last move from the 80.33 low are aligned around 81.60.
In short, there is a major hurdle for sellers around 81.60. If the pair moves higher from the current levels, then the triangle resistance area could stall gains. A break above the same could take the NZD/JPY pair towards the last swing high of 82.67.
