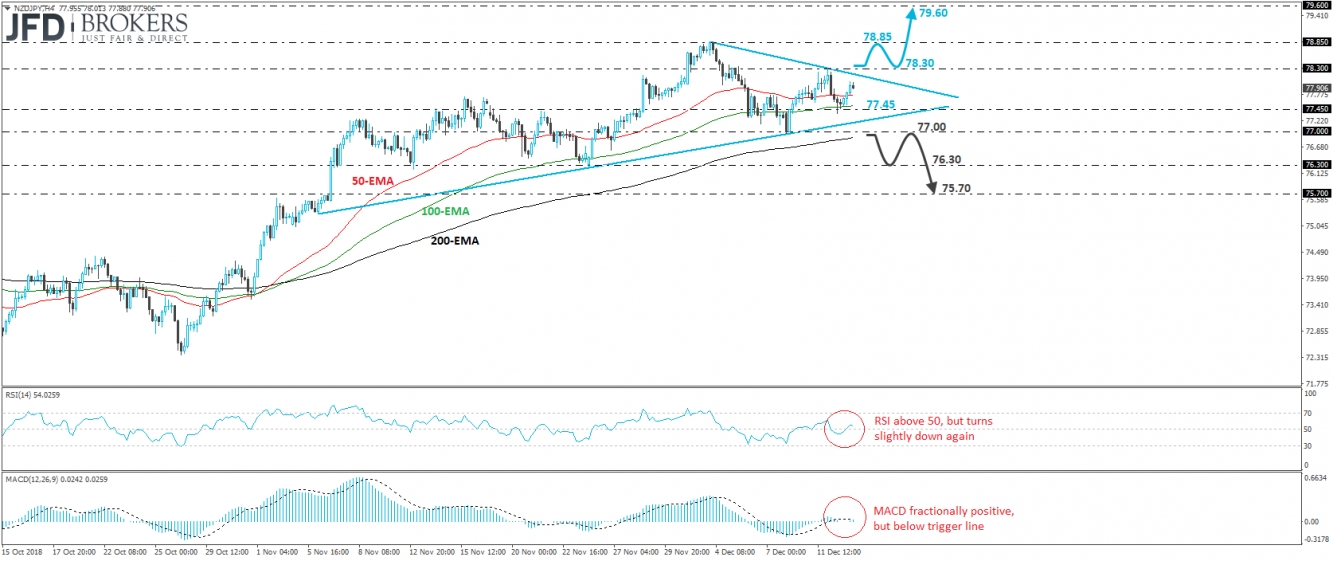
NZD/JPY traded higher after if found support at around 77.45 yesterday. That said, although the rate is still trading above the upside support line drawn from the low of the 6th of November, it also remains below yesterday’s peak of 78.30, as well as below the tentative downside resistance line taken from the high of the 4thof December. What’s more, all three of our moving averages have flattened. Therefore, we prefer to adopt a wait-and-see stance for now.
A clear and decisive move above 78.30 could confirm the break above the aforementioned tentative downside line and may signal the resumption of the prevailing uptrend. The bulls could then drive the battle towards the 78.85 obstacle, marked by the highs of the 3rd and 4th of December, the break of which could confirm a forthcoming higher high on the daily chart and would bring the rate into territories last seen back in April. Something like that may allow buyers to push the rate towards the high of the 13th of April, at around 79.60.
On the downside, we would like to see a strong dip below 77.00 before we start examining whether the bears have gained the upper hand, at least in the short run. Such a break could signal the break of the upside line drawn from the low of the 6th of November, as well as the completion of a failure swing top. The rate could then slide towards the 76.30 zone, which provided decent support on the 12th, 13th and 25th of November. Another dip below that area may carry extensions towards the 75.70 territory, which is slightly above the high of the 2nd of November.
Taking a look at our short-term momentum indicators, we see that the RSI rebounded, crossed back above 50, but has now turned slightly down again. The MACD lies fractionally above zero, slightly below its trigger line, and points sideways. These technical studies suggest lack of momentum and support our choice to stand pat for now.

