Following the celebration of Thanksgiving, liquidity remains thin whilst volatility is very low. This is likely compounded by the fact we had large moves on the US Dollar following the Fed minutes in the hour leading up to traders hanging up their gloves for the week. So this seems like a good time to step back and look at some potential moves for next week, assuming they don’t present themselves sooner.
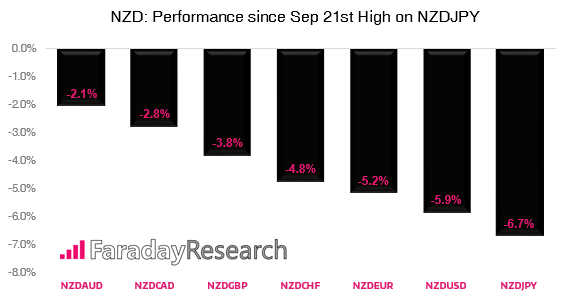
Focusing on NZD crosses, NZDJPY has provided the most bearish momentum among the group since printing a prominent high on 21st September. Whilst there have been two clear pullbacks, is has been a powerful downtrend which could still make a move for the April lows.

Weighing up conflicting signals
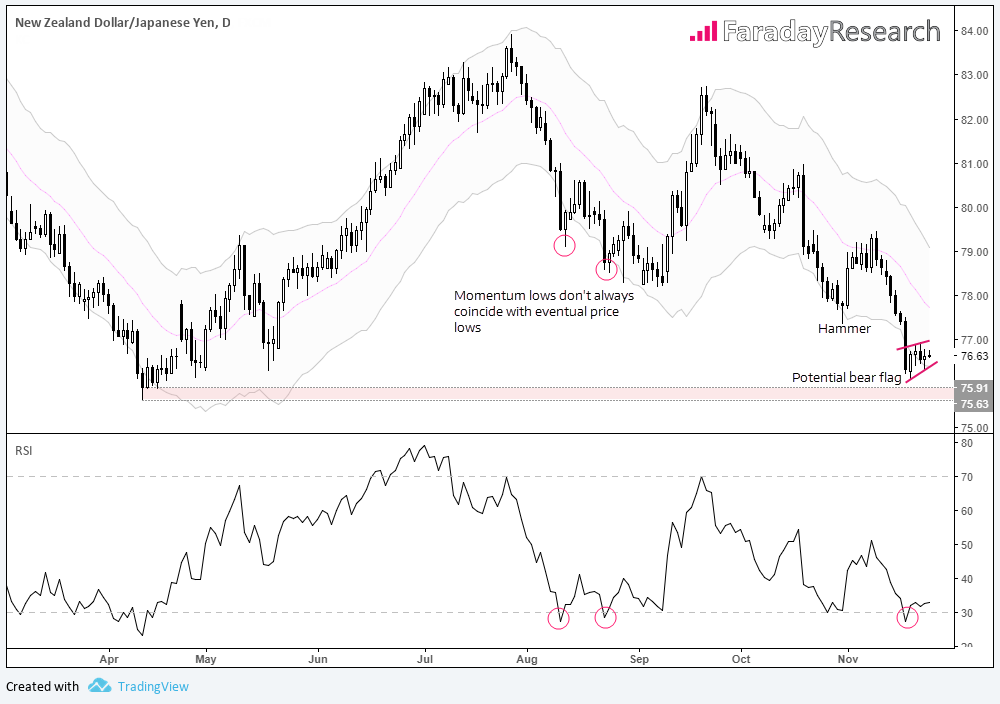
Price action of the past five days suggests a bearish flag could be forming, and that compression is underway. That these tend to be continuation patterns and they follow on from a bearish range expansion and predominantly bearish momentum, we’re looking out for potential short opportunities. Assuming volatility is to remain low until next week, this allows for a relatively low volatility pullback to finalise before attempting another leg lower. However, this is where patience is key as the threat for this to rebound higher is also present.
The bearish range expansion last week took NZDJPY outside of the lower Keltner band before making a mild rebound back inside the band. The last time we saw price action test the lower band was on 31st October which sparked the beginning of a deep correction. That said, there is a stark difference between the two examples. October’s low provided a bullish hammer before momentum switched and provided a bullish range expansion the following day. However, price action this time around is showing signs of compression and has merely drifted back inside the bands. Assuming the dominant bearish momentum remains intact, trend theory assumes a move lower is more probable than a move higher, with the potential bear flag being the icing on the cake (if confirmed).
Another consideration for bears to weigh up is that RSI reached its lowest point since April beneath the 30 level (oversold). This could indeed mark a significant turning point for NZDJPY like it did in April, yet we should also point out that a momentum low doesn’t always mark the eventual price low. Two examples are the swing lows of August which saw prices move lower in line with the trend.

How is one to approach these conflicting signals?
The simple answer is to wait and let price action confirm a decisive break in either direction.
As long as volatility remains low whilst prices move higher, an eventual downside move could still be favoured. The upside to this scenario is it increases the potential reward to risk ratio, and the trigger would be for price on the hourly to break a key level, trendline or compression candle. Alternatively, we could consider shorting NZDJPY if bearish momentum is to return around current level, but the theoretical reward to risk ratio would be smaller. Both scenarios assume we are targeting the 75.63-91 lows.
