Hi traders,
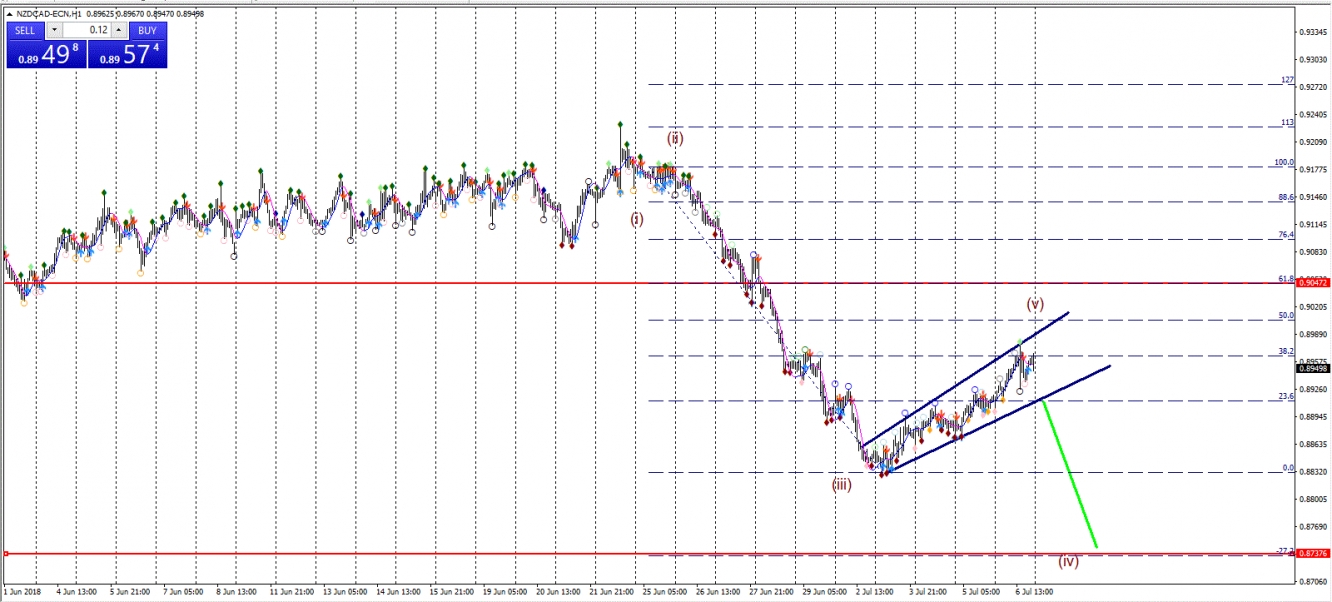
NZD/CAD developed a bearish momentum during the last two weeks... It seems that this price action was developing 5 bearish wave pattern I think that the pair is now in a bullish wave 4. We will review different scenarios as the pair can either bounce for bearish momentum or continue the bullish momentum of wave 4.
This article will discuss the wave perceptive and expected scenarios for the pair during the coming days using wave pattern, support, and resistance and SWAT software.
NZD/CAD Wave Pattern
The below chart shows that the pair developed a bullish momentum... In my view, the pair is in wave 4 now and we are still looking for the confirmation of bearish wave 5. And here are the main conclusions:
- Wave 4 ratio can be 23.6% ,38.2%,,50% and sometimes 61.8%.
- Price can bounce at any of the above ratios.
- Wave 5 final target is usually at 27.2% Fibonacci level.
- Traders should wait for confirmation before.
For the moment I expect the bearish momentum to complete 12345 wave pattern... Traders need to wait for the confirmations for the setup entry point... In the next paragraph, we will discuss this development by using SWAT software.
NZD/CAD SWAT CHART Present Wadge
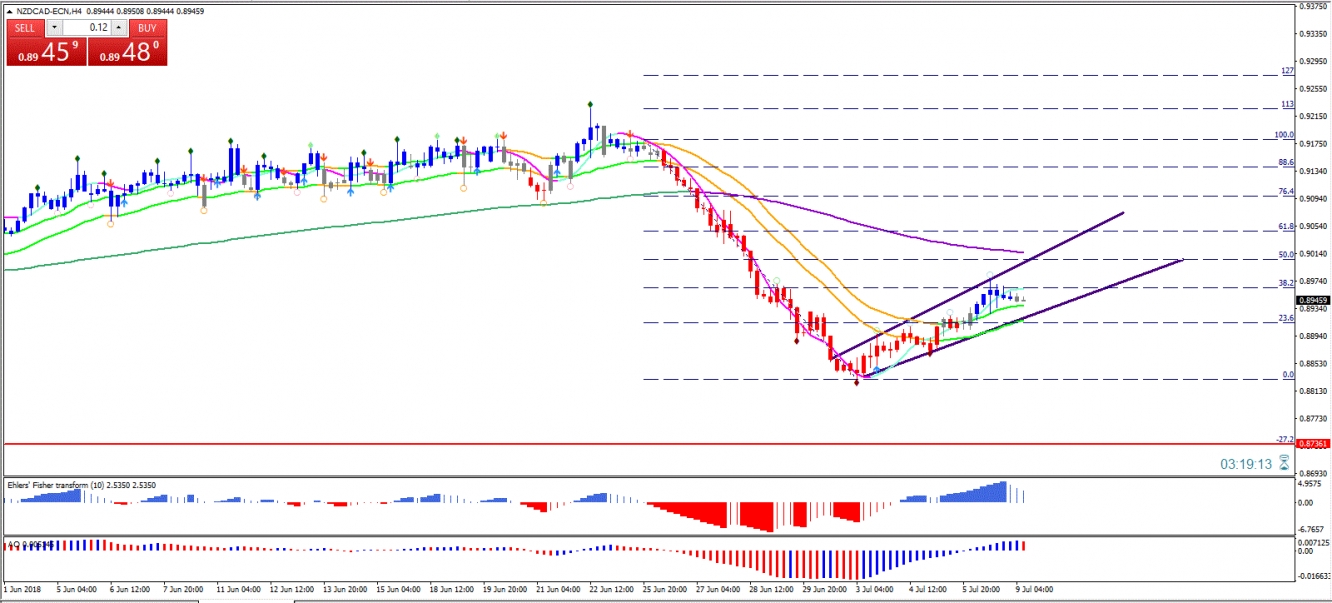
Now it’s time to use the SWAT 4-hour chart to determine the entry points according to the expected wave patterns... SWAT Chart shows bullish momentum but some developments to confirm the setup and the start of the bearish momentum... Here are the main developments to consider:
- Need strong bearish candle to break and 21 EMA and a break of the wadge.
- Our target is the around -27.2%.
- I advise traders always to protect their profit or use trailing stops.
So in my view, traders should wait for the confirmation before trading this pair and look for short opportunities only as it matches the expected wave.
Good trading,
Ahmed

