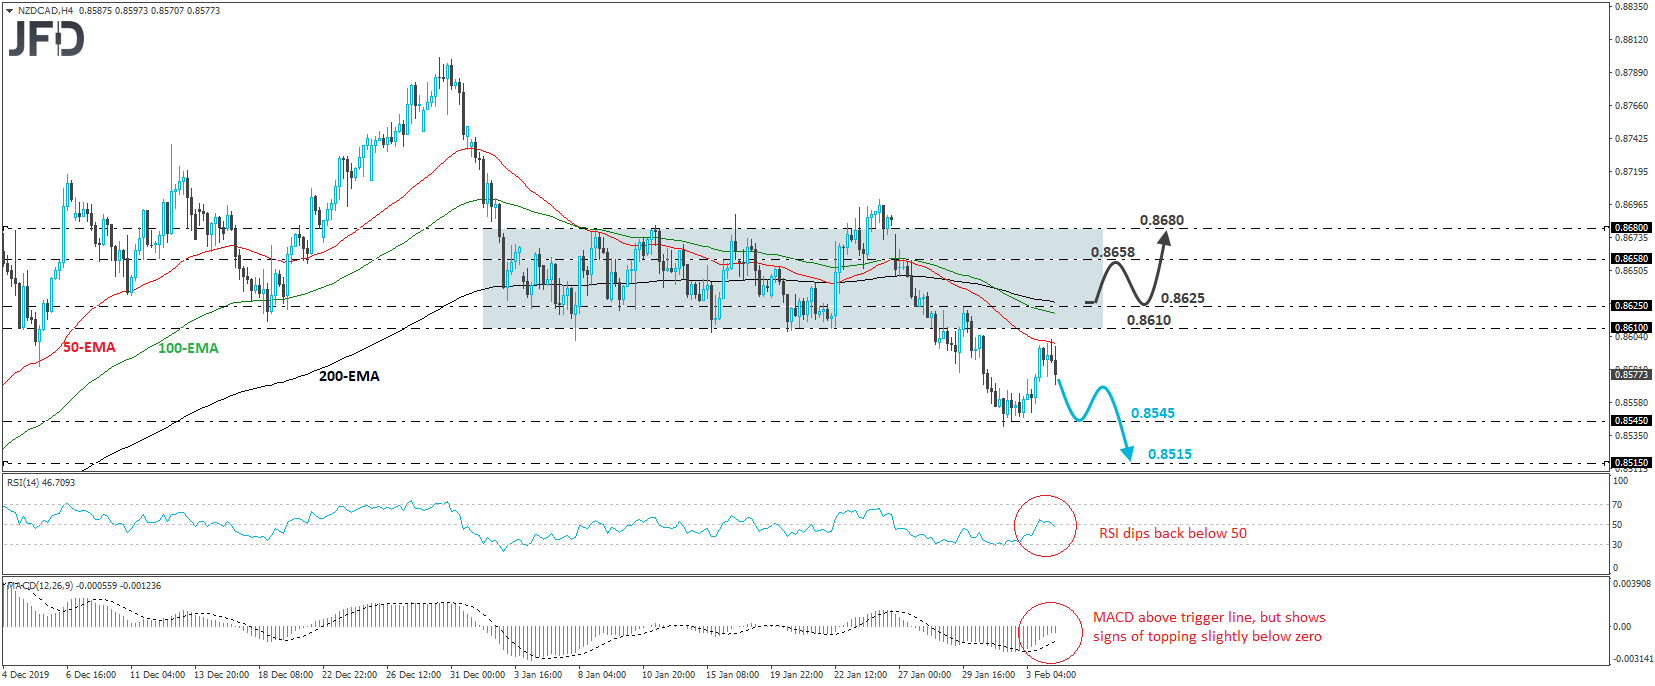
NZD/CAD traded higher yesterday but hit resistance near the 20-EMA on the 4-hour chart, slightly below 0.8610, which is the lower end of the sideways range that was containing most of the price action from January 3rd until the 28th. Today, the rate retreated somewhat. Bearing in mind that the pair continues to trade below the lower bound of the range, we would consider the short-term outlook to be cautiously bearish for now.
If the bears are willing to stay behind the steering wheel, we would expect them to target again the lows of Friday and yesterday, at around the 0.8545 territory. They may decide to take a short break after testing that zone, thereby allowing another corrective rebound. That said, if they regain control from below the lower bound of the aforementioned range, we would expect the forthcoming negative wave to result in the break of the 0.8545 hurdle, something that may open the way towards the 0.8515 zone, which provided decent support between November 25th and 29th.
Taking a look at our short-term oscillators, we see that the RSI turned down and just dipped back below its 50 line, while the MACD, although above its trigger line, shows signs of topping slightly below zero. Both indicators suggest that the rate has started picking up downside speed again and support the notion for some further near-term declines.
In order to abandon the bearish case and turn back neutral, we would like to see a recovery above 0.8625. Such a move may confirm the rate’s return within the pre-discussed sideways path and may allow advances towards 0.8658. Another break, above 0.8658, could pave the way towards the upper end of the range, at around 0.8680.

