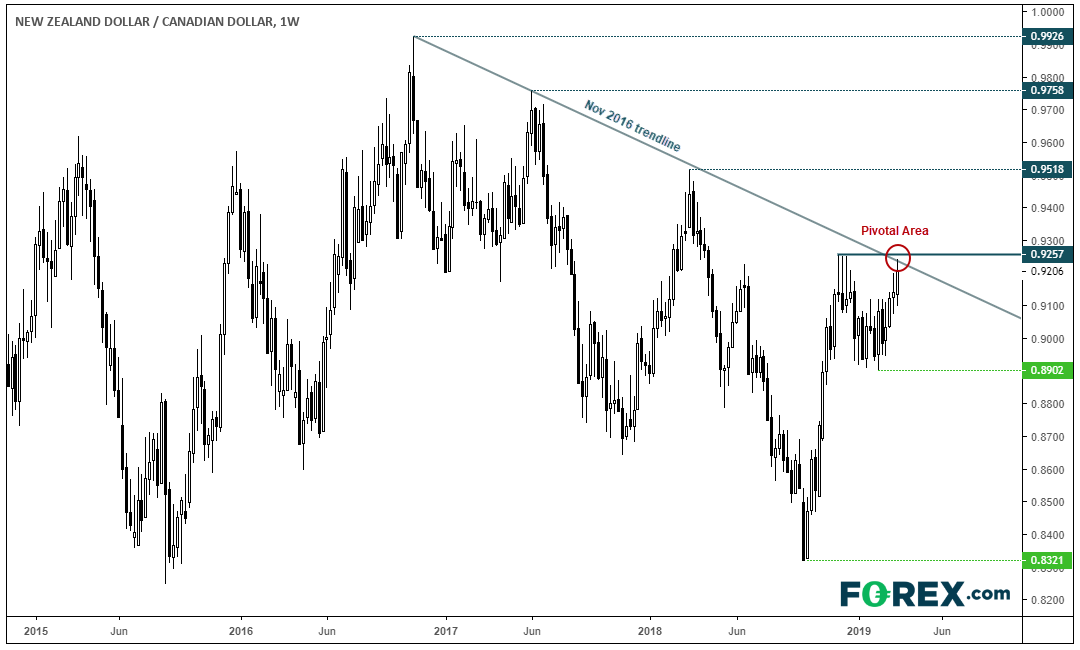
The past few weeks has seen NZD have the upper hand over its commodity FX rival, CAD. Yet it could be approaching crunch time as yesterday’s high almost perfectly bounced of a 2-year trendline (just in time for Canada’s data dump today).

The weekly chart shows resistance has been found at pivotal level. If the November 2016 trendline holds and bearish momentum is to return, it could see a resumption of its 2-year trend over the coming weeks. However, the daily chart has its merits for the bull-camp.
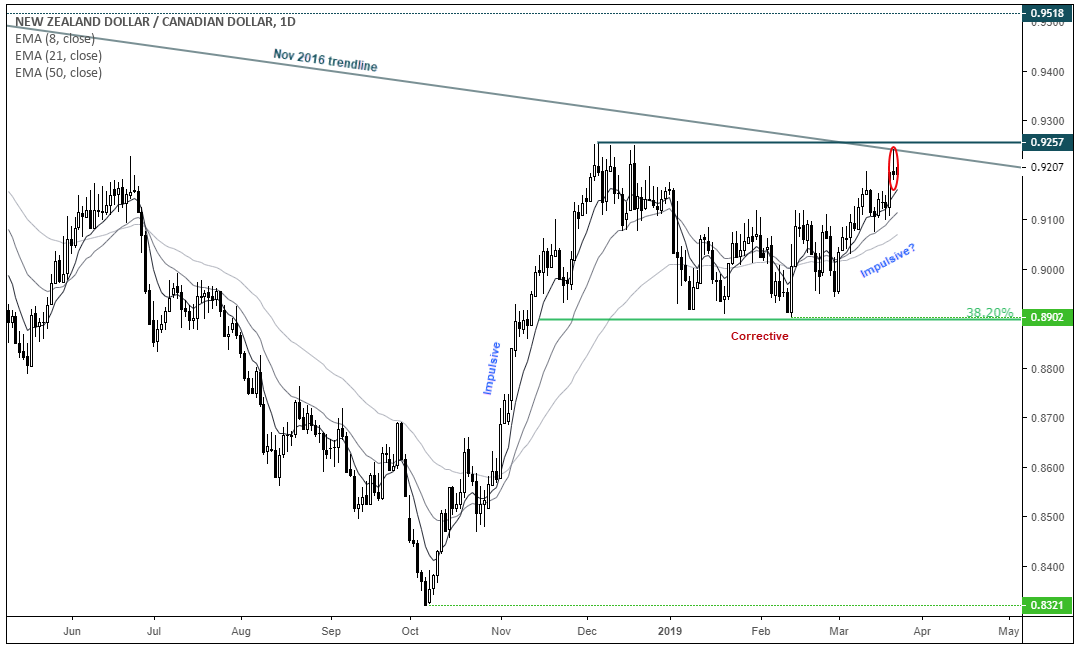
The rally from 0.8320 appears impulsive, and the retracement from 0.9572 respected the 38.2% Fibonacci retracement, prior to re-testing the December highs. Moreover, the 8, 21 and 50 eMA’s are fanning out to show an increase in momentum, and recent retracements have found dynamic support with the shorter averages.

A bearish pinbar shows a hesitancy to break higher, yet perhaps this could be expected given the importance of the trendline and the host of Canadian data released today. But, if the daily trend is to hold, a break above 0.9277 invalidates the bearish trendline and opens-up a run for 0.9581.
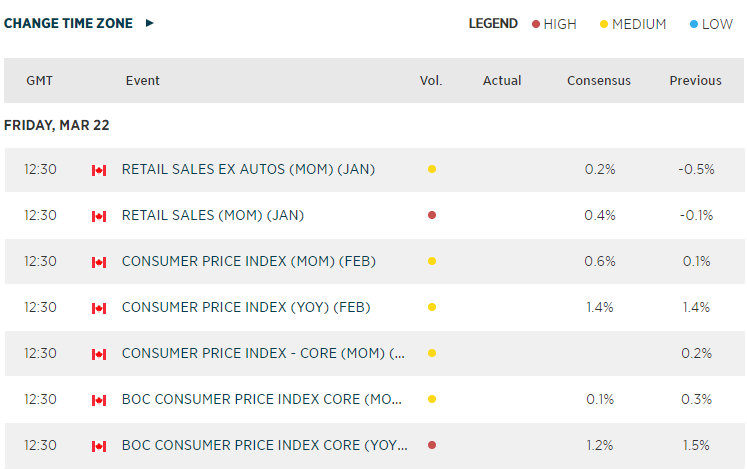
Keep in mind a host of Canadian data is released later today, and the BOC remain data dependant. Although BOC and RBNZ have their rates set at 1.75%, RBNZ is the more neutral bank of the two, meaning a strong or weak data set for Canada today could bring forward or push back expectations for their next hike, will dictate CAD’s direction. Therefor Canada’s data today could dictate which side of the trendline we close the week on, whilst could dictate sentiment as we head into next week.

