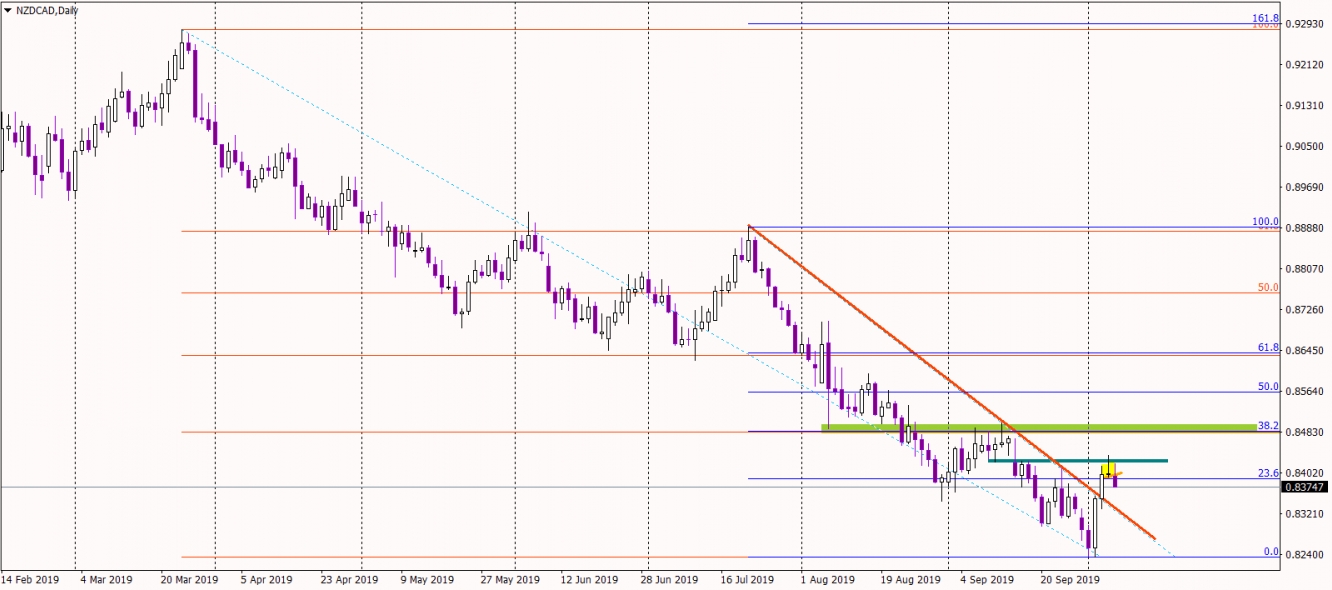
Today, we have something more exotic for our traders – NZD/CAD. We always say that, you do not have to trade only majors and those instruments, which are the most popular. Technical analysis gives you the freedom of trading, wherever you can find reliable trading patterns and formations. That is why, we often scan those less popular instruments. Setups that can be found there are definitely not less trustworthy than those found on majors.
October started quite decent here. The pair reversed creating two nice bullish candles. It all stopped on Friday when NZD/CAD created a typical shooting star formation on the daily chart. The place, where this formation emerged was not random – that is a legitimate mid-term horizontal resistance (dark green). Yes, it would be much better if NZD/CAD, created this pattern a bit higher, on the light green resistance (together with two important Fibonacci retracements) but this only shows us the current weakness of the buyers.

It is worth adding that the daily shooting star, on lower timeframes (H1), creates the Head and Shoulders pattern. The H&S is already up and running as the breakout of the neckline happened few hours ago. With all this, the sentiment can be only negative and will stay that way, as long as we are below the 0.843 resistance (dark green). The target for this drop is on the lows from the beginning of October, which gives us a decent risk to reward ratio.
