May was a bad month for the Kiwi dollar, with price accelerating lower after RBNZ Governor Wheeler revealed that the RBNZ has been actively selling NZD in order to weaken the currency which is deemed too high. Rate cuts were also threatened, sending NZD/USD sharply lower which was exacerbated by USD gaining in strength spectacularly. There was no reprieve to be had even as we entered the final day of May, with price closing at the month’s absolute low of 0.7938 on Friday.
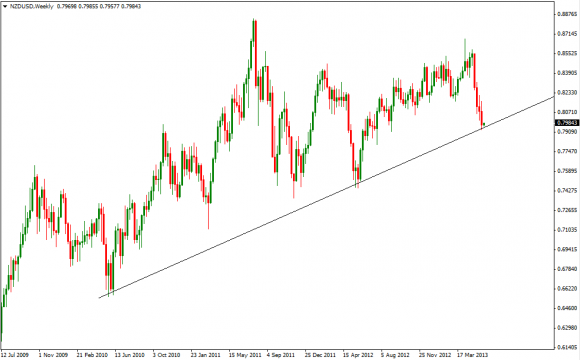
Weekly Chart
This would naturally mean that the overall bearishness should be strong, and continued sell-off today should be reasonably expected. However that did not happen, instead price traded marginally higher today. This is strange as a strong bearish maribozu (on both daily and weekly) should generally be followed by a gap lower on the next trading day open. A move higher suggest that something else must have happened during the off market hours, which is not true in this case. But certainly there must be something that managed to negate the strong bearish sentiment of Friday.By the process of elimination, we are left with the fact that the multi-year rising trendline is providing the support that has rebuffed the bears. With this trendline standing in the way, it may be hard for bears to trade lower without adding further impetus into the current momentum.
Is there anything that can provide that extra push? USD seems to be continuing to strengthen despite US stocks trading lower on Friday. With US stocks looking softer now, the previous belief is that NZD/USD will be able to rally up from here, taking advantage of USD’s weakness. However now it seems that USD is having an inverse relationship with stocks, which would actually mean that risk aversion would actually bring NZD/USD lower, which may be the impetus that bears need to break the multi-year trendline.
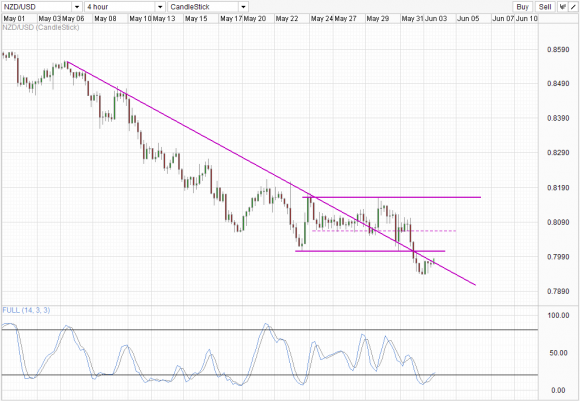
4 Hourly Chart
4 hourly chart show price trading above the descending trendline. If price manage to break the 0.80 level, the previous 0.800 – 0.818 consolidation will come into play again, providing much needed support and allowing price to aim for 0.818 and setting up a rebound from the multi-year trendline. Stochastic readings suggest that this scenario is plausible with readings just peeking above the 20 levels and seeking higher grounds.
Fundamentally, we know that RBNZ is heavily bearish, and that is favorable to the bears. However it is worth noting that RBNZ is currently having more bark than bite, with Governor Wheeler going on record saying that they are not able to execute rate cuts in fear of the housing market bubbling out of control. As it is, housing price continue to spiral, with demand continue to climb which resulted in the latest Building Permits figure climbing 18.5% M/M. With that in mind, it is highly unlikely that RBNZ will have the scope needed to slash rates like their Australian counterpart. This lead to RBNZ resorting to weakening NZD purely via secondary market action, which has a mixed result at best, and utter failure at worst (just ask BOJ, BOE and various other Asian Central Banks that have failed over the years). A large part of the decline in May can be attributed to speculators giving RBNZ a head start, and not a good fundamental representation of where NZD/USD should be. If RBNZ do not carry out rate cuts anytime soon, it is likely that these speculators may run out of patience and push NZD/USD higher – after all they are already deep in the money already.
This would be in line with the rebounding scenario, and bulls would be keeping their fingers crossed that speculators turned quickly now, if not technical pressures may only serve to encourage speculators to hold their short positions further if the multi-year trendline is broken. It is make or break time.
- English (UK)
- English (India)
- English (Canada)
- English (Australia)
- English (South Africa)
- English (Philippines)
- English (Nigeria)
- Deutsch
- Español (España)
- Español (México)
- Français
- Italiano
- Nederlands
- Português (Portugal)
- Polski
- Português (Brasil)
- Русский
- Türkçe
- العربية
- Ελληνικά
- Svenska
- Suomi
- עברית
- 日本語
- 한국어
- 简体中文
- 繁體中文
- Bahasa Indonesia
- Bahasa Melayu
- ไทย
- Tiếng Việt
- हिंदी
NZD/USD: Tagging Multi-Year Trendline
Published 06/03/2013, 07:06 AM
Updated 07/09/2023, 06:31 AM
NZD/USD: Tagging Multi-Year Trendline
Latest comments
Loading next article…
Install Our App
Risk Disclosure: Trading in financial instruments and/or cryptocurrencies involves high risks including the risk of losing some, or all, of your investment amount, and may not be suitable for all investors. Prices of cryptocurrencies are extremely volatile and may be affected by external factors such as financial, regulatory or political events. Trading on margin increases the financial risks.
Before deciding to trade in financial instrument or cryptocurrencies you should be fully informed of the risks and costs associated with trading the financial markets, carefully consider your investment objectives, level of experience, and risk appetite, and seek professional advice where needed.
Fusion Media would like to remind you that the data contained in this website is not necessarily real-time nor accurate. The data and prices on the website are not necessarily provided by any market or exchange, but may be provided by market makers, and so prices may not be accurate and may differ from the actual price at any given market, meaning prices are indicative and not appropriate for trading purposes. Fusion Media and any provider of the data contained in this website will not accept liability for any loss or damage as a result of your trading, or your reliance on the information contained within this website.
It is prohibited to use, store, reproduce, display, modify, transmit or distribute the data contained in this website without the explicit prior written permission of Fusion Media and/or the data provider. All intellectual property rights are reserved by the providers and/or the exchange providing the data contained in this website.
Fusion Media may be compensated by the advertisers that appear on the website, based on your interaction with the advertisements or advertisers.
© 2007-2024 - Fusion Media Limited. All Rights Reserved.