The multi-year trendline that has been keeping bears at bay is finally broken last Friday, long live the trendline. However that would also mean that bears will be able to usher in a new era of lows from here out. Currently we’re trading below the 0.785 round number cum interim floor back in Jul 2012, and a confirm break will open up 0.745 as the next level of support. Beyond 0.745, we will need to start looking at Monthly Chart for relevant support/resistances (not shown in this article), which 0.735 has proven to be highly significant, acting as the support back between June 2007 – June 2008, and the ceiling from September 2009 – September 2010, and the floor immediately after from October 2010 - March 2011.
Weekly Chart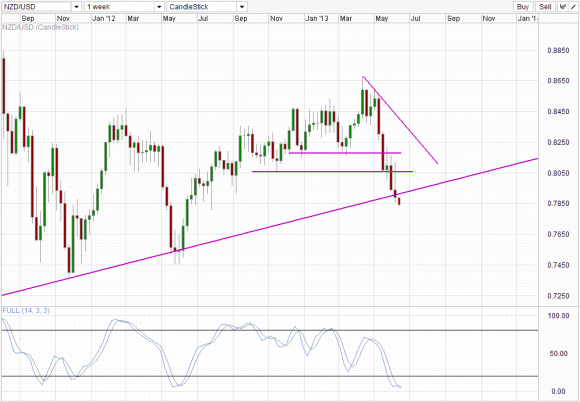 NZD/USD_1" title="NZD/USD_1" width="580" height="402">
However, there is a possibility of a fakeout happening right now. Even though the breaking of the Multi-Year trendline technically happened last Friday, it is worth noting that such trendlines are never drawn precisely, furthermore this being a multi-year line, any slight shift of 0.1 degree can result in a shift of 10-30 pips at the bare minimum. Hence it will be considered aggressive to consider last Friday’s closing level as a break without seeking any further confirmation. Considering that Stochastic readings are currently extremely Oversold, perhaps some prudence should be exercised.
Hourly Chart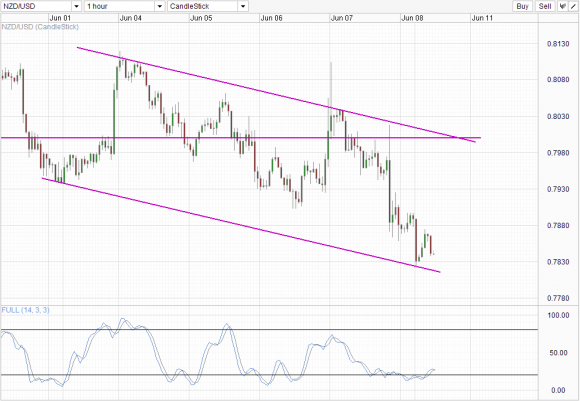 NZD/USD_2" title="NZD/USD_2" width="580" height="401">
Short-term chart is also bearish, with the descending Channel firmly in play. However, price appears to have bounce off Channel bottom during early Asian session and that may result in a push towards Channel Top. This would enhance the probability of a Fakeout as described in the Weekly Chart above. Conversely, should price manage to break the Channel and usher in an accelerated move lower, this can act as a confirmation for the bearish breakout on the Weekly Chart. Stochastic on the short-term chart favors a move higher though, with readings pushing higher after clearing the 20.0 level. However there could be a case for an interim peak for Stochastic as Stoch line is looking likely to cross Signal line right now, with historical readings showing that current Stoch levels have a tendency to form peaks in the past.
Fundamentally, NZD/USD is weak due less to a weakening economy but rather due to the extremely dovishness of RBNZ, which has been made clear by RBNZ Governor Wheeler. However, even so, it is unlikely that RBNZ’s intervening of NZD via selling it directly in the secondary markets have any long-lasting effect such as this. A large part of current decline can actually be attributed to the bearish sentiments surrounding AUD/USD which has climbed around 1,200 pips from its 2013 high. With that in mind, will NZD/USD rebound higher when such sentiment evaporate – ala USD/JPY right now? The possibility is there, hence the confirmation for current breakout become all the more imperative.
Original post
- English (UK)
- English (India)
- English (Canada)
- English (Australia)
- English (South Africa)
- English (Philippines)
- English (Nigeria)
- Deutsch
- Español (España)
- Español (México)
- Français
- Italiano
- Nederlands
- Português (Portugal)
- Polski
- Português (Brasil)
- Русский
- Türkçe
- العربية
- Ελληνικά
- Svenska
- Suomi
- עברית
- 日本語
- 한국어
- 简体中文
- 繁體中文
- Bahasa Indonesia
- Bahasa Melayu
- ไทย
- Tiếng Việt
- हिंदी
NZD/USD: Multi-Year Trendline Broken, Awaiting Confirmation
Published 06/10/2013, 01:49 AM
Updated 07/09/2023, 06:31 AM
NZD/USD: Multi-Year Trendline Broken, Awaiting Confirmation
Latest comments
Loading next article…
Install Our App
Risk Disclosure: Trading in financial instruments and/or cryptocurrencies involves high risks including the risk of losing some, or all, of your investment amount, and may not be suitable for all investors. Prices of cryptocurrencies are extremely volatile and may be affected by external factors such as financial, regulatory or political events. Trading on margin increases the financial risks.
Before deciding to trade in financial instrument or cryptocurrencies you should be fully informed of the risks and costs associated with trading the financial markets, carefully consider your investment objectives, level of experience, and risk appetite, and seek professional advice where needed.
Fusion Media would like to remind you that the data contained in this website is not necessarily real-time nor accurate. The data and prices on the website are not necessarily provided by any market or exchange, but may be provided by market makers, and so prices may not be accurate and may differ from the actual price at any given market, meaning prices are indicative and not appropriate for trading purposes. Fusion Media and any provider of the data contained in this website will not accept liability for any loss or damage as a result of your trading, or your reliance on the information contained within this website.
It is prohibited to use, store, reproduce, display, modify, transmit or distribute the data contained in this website without the explicit prior written permission of Fusion Media and/or the data provider. All intellectual property rights are reserved by the providers and/or the exchange providing the data contained in this website.
Fusion Media may be compensated by the advertisers that appear on the website, based on your interaction with the advertisements or advertisers.
© 2007-2024 - Fusion Media Limited. All Rights Reserved.