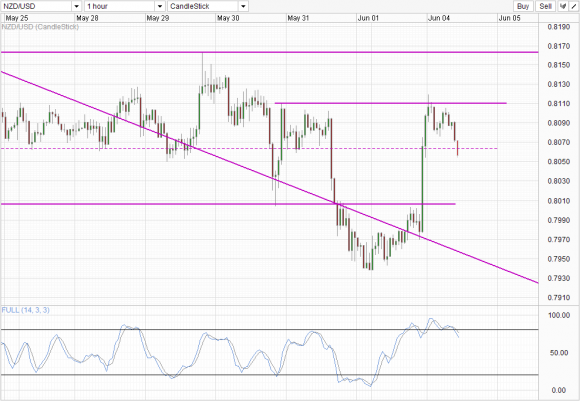
The Kiwi traded higher above the short-term descending trendline during the European Morning session, pushing up towards the 0.800 level. However the level proved to be a tough nut to crack, with NZD/USD retreating before US trading opened. The descending trendline resistance subsequently became a strong support, stopping the decline during US open together with the confluence with 0.798 interim ceiling during early Asian trade. When US session started fully, NZD/USD was propelled above 0.801. It is debatable whether the strong move is due to bulls trading the rebound of the descending trendline, or perhaps it has more to do with the fact that USD weakened surprisingly despite US stocks rising. This in itself is also surprising, as US stocks went against the grain with European and Asian stocks trading mostly lower yesterday. The truth is most likely somewhere in between, with both technical and USD weakening playing a part to send price back within the 0.800 – 0.817 trading range that is in play.
Hourly Chart
Price managed to tag above 0.810 on the back of the double boosters, but ultimately price failed to break the tighter consolidation of 0.806 – 0.8110 (in play between 24th May – 29th May) found within the wider consolidation. Currently price is threatening to break below floor of the tighter consolidation, suggesting that overall bearish sentiment remains. Stochastic readings suggest the same, with readings heading lower after breaking the 80.0 level, hinting that a bear cycle may be underway, with 0.800 and the descending trendline as possible targets.
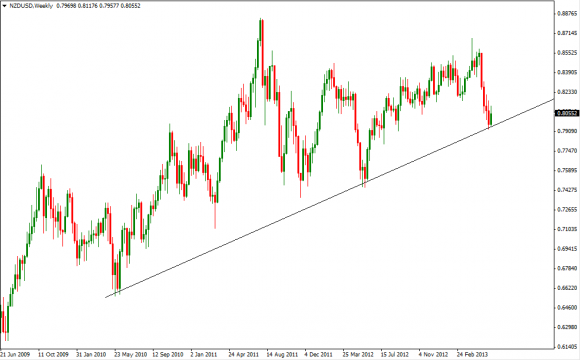
Weekly Chart
The same can be said of the rebound from the multi-year rising trendline. Though the early signs are promising, price started to retrace after reaching the candle 2 weeks ago (week of May 19th) which is the point of inflexion for current bearish trend. This is a sign for caution, but certainly it is still too early to tell as we’ve only have experienced 1 full day of trading this week, with 4 more to come. Nonetheless, a strong bullish showing in favor of a rebound from here will require price to trade above the opening levels of Week of May 19th, and preferably be accompanied by another bull candle next week to establish a stronger case for a move beyond 0.82.
Fundamentally, there is nothing much from the Kiwi side. The NZ Treasury came up once more to emphasize the negative impact of the recent drought, saying that it will shave 0.7% off the GDP headline growth rate. However that is considered to be old news, with latest consumer sentiment data showing relatively bullish opinions. RBNZ certainly wants a weaker NZD, but it is unlikely that they will be able to wrestle control of the currency from the market without implementing rate cuts which they are reluctant to do so in view of rising house prices. Hence, direction of NZD/USD remains in the court of USD for now. Continue to watch the correlation between USD and US stocks, and this week’s post NFP reaction may provide the watershed moment to see how USD react to bullish/bearish news and will be invaluable in helping us understand better current market psyche and potential June direction.
- English (UK)
- English (India)
- English (Canada)
- English (Australia)
- English (South Africa)
- English (Philippines)
- English (Nigeria)
- Deutsch
- Español (España)
- Español (México)
- Français
- Italiano
- Nederlands
- Português (Portugal)
- Polski
- Português (Brasil)
- Русский
- Türkçe
- العربية
- Ελληνικά
- Svenska
- Suomi
- עברית
- 日本語
- 한국어
- 简体中文
- 繁體中文
- Bahasa Indonesia
- Bahasa Melayu
- ไทย
- Tiếng Việt
- हिंदी
NZD/USD: Bouncing Off Multi-Year Trendline But ST Bears Remain
Published 06/04/2013, 03:33 AM
Updated 07/09/2023, 06:31 AM
NZD/USD: Bouncing Off Multi-Year Trendline But ST Bears Remain
Latest comments
Loading next article…
Install Our App
Risk Disclosure: Trading in financial instruments and/or cryptocurrencies involves high risks including the risk of losing some, or all, of your investment amount, and may not be suitable for all investors. Prices of cryptocurrencies are extremely volatile and may be affected by external factors such as financial, regulatory or political events. Trading on margin increases the financial risks.
Before deciding to trade in financial instrument or cryptocurrencies you should be fully informed of the risks and costs associated with trading the financial markets, carefully consider your investment objectives, level of experience, and risk appetite, and seek professional advice where needed.
Fusion Media would like to remind you that the data contained in this website is not necessarily real-time nor accurate. The data and prices on the website are not necessarily provided by any market or exchange, but may be provided by market makers, and so prices may not be accurate and may differ from the actual price at any given market, meaning prices are indicative and not appropriate for trading purposes. Fusion Media and any provider of the data contained in this website will not accept liability for any loss or damage as a result of your trading, or your reliance on the information contained within this website.
It is prohibited to use, store, reproduce, display, modify, transmit or distribute the data contained in this website without the explicit prior written permission of Fusion Media and/or the data provider. All intellectual property rights are reserved by the providers and/or the exchange providing the data contained in this website.
Fusion Media may be compensated by the advertisers that appear on the website, based on your interaction with the advertisements or advertisers.
© 2007-2024 - Fusion Media Limited. All Rights Reserved.