Last week was not a good week for the Kiwi, at least if you are bullish on currency. I’m sure RBNZ Governor Wheeler and also Prime Minister Key and Finance Minister English will be happy with a weaker NZD/USD.
Whatever your preference may be, we would have to seriously consider that the rally from 0.818 (March low) is officially over with a break of the 0.838 last week. 0.838 was still rather resilient even after the revelation by Wheeler that RBNZ was actively selling NZD to artificially weaken it.
Thursday’s (Wednesday EDT) much stronger than expected employment data affirmed 0.838 support with price rallying up strongly, but the inability to push above 0.848 was the bulls’ undoing, as bears proved to be too strong to be banished, with price collapsing in spectacular fashion, crossing below 0.833 by the time Friday trading stopped.
Daily Chart
 NZD/USD" title="NZD/USD" width="580" height="397" />
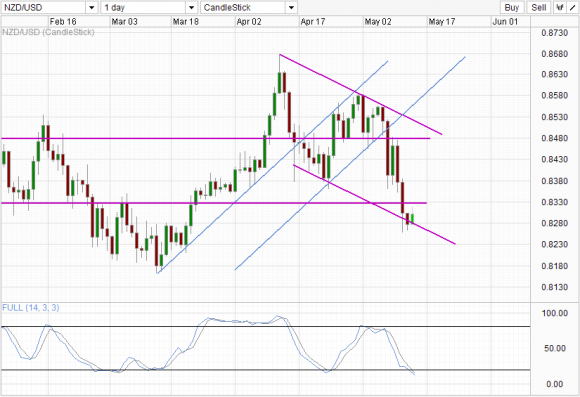
However, bulls may find some reprieve soon, with price currently at the bottom of the newly formed channel. However, it is important to note the reliability (or lack-thereof) of this channel due to the current bottom having only 2 touch points, with the 2nd point being current price action, similar to the channel found in USD/SGD.
However, should the channel prove to be relevant, we could see price bouncing higher from here toward 0.833 which will be the watershed moment to determine if a retest towards 0.848 (and confluence with a channel top) is possible, or a return towards 0.818 may be in play. Stochastic readings suggest that price may embark on a bull cycle soon with Stoch/Signal lines closing into each other, the prerequisite for a Stoch/Signal cross.
Hourly Chart
 NZD/USD" title="NZD/USD" width="580" height="397" />
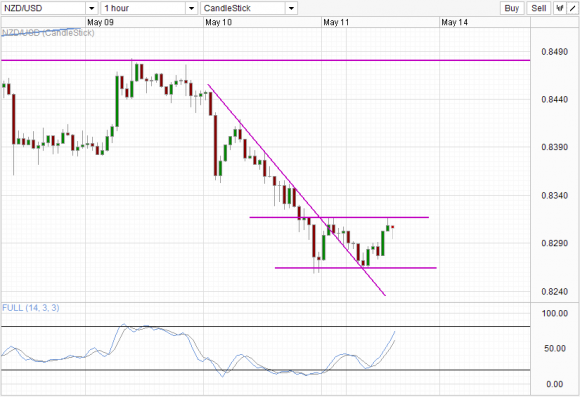
The hourly chart is also bullish following the rebound of the intersection between Friday’s lows and the descending trendline that was in play just recently. Stochastic readings are also pointing higher, suggesting that price may still point higher with the overbought region still some distance away.
However, the 0.8315 ceiling stands in the way, and with overall bearish pressure still strong, bulls may need something extra other than a technical rebound to have prices pushing through the interim resistance. In this case, there may be underlying bulls still lying around as prices remain bullish despite the fact that the latest Chinese Industrial data (1 candle ago) came in weaker than expected.
This should generally result in a weaker NZD/USD as New Zealand exports heavily into China. Australia which has similar characteristics in this regard, traded lower following the news, thus highlighting the inherent bullishness of NZD/USD which may just be enough for price to push up higher beyond 0.8315.
Even then, price is expected to find further resistances around 0.834, and also 0.838 – 39, hence it will indeed require a strong fundamental shift in either NZD economics or USD fundamentals to move up higher. In this regard, traders may want to keep a keen lookout on the USD’s strength in the near term. Much of the recent strength can be attributed to the rally in US stocks. However, early signs from futurestrading suggest that US stocks are likely to trade lower today, which may result in the USD pulling back and a higher NZD/USD.
Short-term fundamentals may favor the NZD as well, with Kiwi Housing Sales and the Housing Price Index rising, directly opposite of what Governor Wheeler wants. Wheeler has previously threatened to slash rates should housing prices start to come down, and this latest data suggests that a rate cut may take longer to come, which explains the inherent bullishness observed above. However, this bullishness is not expected to last in the long-term, as eventually, the dovishness of a Central Bank will most likely trump any conflicting economic data.
Whatever your preference may be, we would have to seriously consider that the rally from 0.818 (March low) is officially over with a break of the 0.838 last week. 0.838 was still rather resilient even after the revelation by Wheeler that RBNZ was actively selling NZD to artificially weaken it.
Thursday’s (Wednesday EDT) much stronger than expected employment data affirmed 0.838 support with price rallying up strongly, but the inability to push above 0.848 was the bulls’ undoing, as bears proved to be too strong to be banished, with price collapsing in spectacular fashion, crossing below 0.833 by the time Friday trading stopped.
Daily Chart
 NZD/USD" title="NZD/USD" width="580" height="397" />
However, bulls may find some reprieve soon, with price currently at the bottom of the newly formed channel. However, it is important to note the reliability (or lack-thereof) of this channel due to the current bottom having only 2 touch points, with the 2nd point being current price action, similar to the channel found in USD/SGD.
However, should the channel prove to be relevant, we could see price bouncing higher from here toward 0.833 which will be the watershed moment to determine if a retest towards 0.848 (and confluence with a channel top) is possible, or a return towards 0.818 may be in play. Stochastic readings suggest that price may embark on a bull cycle soon with Stoch/Signal lines closing into each other, the prerequisite for a Stoch/Signal cross.
Hourly Chart
 NZD/USD" title="NZD/USD" width="580" height="397" />
The hourly chart is also bullish following the rebound of the intersection between Friday’s lows and the descending trendline that was in play just recently. Stochastic readings are also pointing higher, suggesting that price may still point higher with the overbought region still some distance away.
However, the 0.8315 ceiling stands in the way, and with overall bearish pressure still strong, bulls may need something extra other than a technical rebound to have prices pushing through the interim resistance. In this case, there may be underlying bulls still lying around as prices remain bullish despite the fact that the latest Chinese Industrial data (1 candle ago) came in weaker than expected.
This should generally result in a weaker NZD/USD as New Zealand exports heavily into China. Australia which has similar characteristics in this regard, traded lower following the news, thus highlighting the inherent bullishness of NZD/USD which may just be enough for price to push up higher beyond 0.8315.
Even then, price is expected to find further resistances around 0.834, and also 0.838 – 39, hence it will indeed require a strong fundamental shift in either NZD economics or USD fundamentals to move up higher. In this regard, traders may want to keep a keen lookout on the USD’s strength in the near term. Much of the recent strength can be attributed to the rally in US stocks. However, early signs from futurestrading suggest that US stocks are likely to trade lower today, which may result in the USD pulling back and a higher NZD/USD.
Short-term fundamentals may favor the NZD as well, with Kiwi Housing Sales and the Housing Price Index rising, directly opposite of what Governor Wheeler wants. Wheeler has previously threatened to slash rates should housing prices start to come down, and this latest data suggests that a rate cut may take longer to come, which explains the inherent bullishness observed above. However, this bullishness is not expected to last in the long-term, as eventually, the dovishness of a Central Bank will most likely trump any conflicting economic data.