Throughout the month of November, the NZD has been able to do something that very few other currencies around the world have been able to do, gain value against the USD/NZD. The outright love of everything USD isn’t something that is unfamiliar to traders out there as US data has been performing admirably and the Federal Reserve has set themselves up for future rate hikes by eliminating the last vestiges of Quantitative Easing. If fact, it is rather surprising to me that the NZD has had such fortune, so here are some reasons outside of simple USD strength that it might not continue.
Milk Prices and Other Fundamental Factors
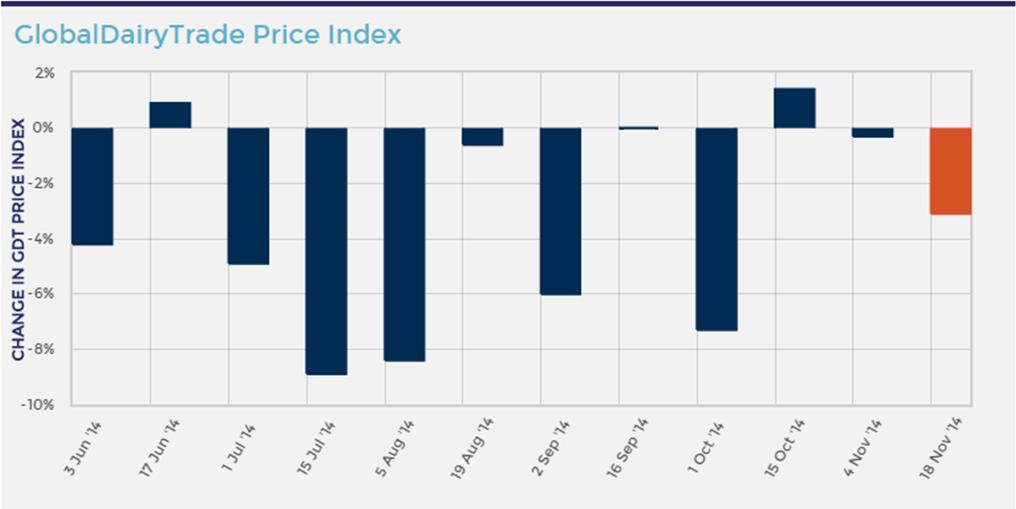
It has been stated that New Zealand is the Saudi Arabia of milk, with approximately one third of international dairy trade going through the nation each year. Therefore the price of the commodity is overwhelmingly significant to the health of the nation. In order to maintain strength in the economy, milk prices need to rise, but that hasn’t been the case over the last few months as you can see from the chart (Figure 1) below. Fundamentally speaking, if this trend of falling prices continues, the NZD may have nowhere to go but down.
Figure 1:
Trend line
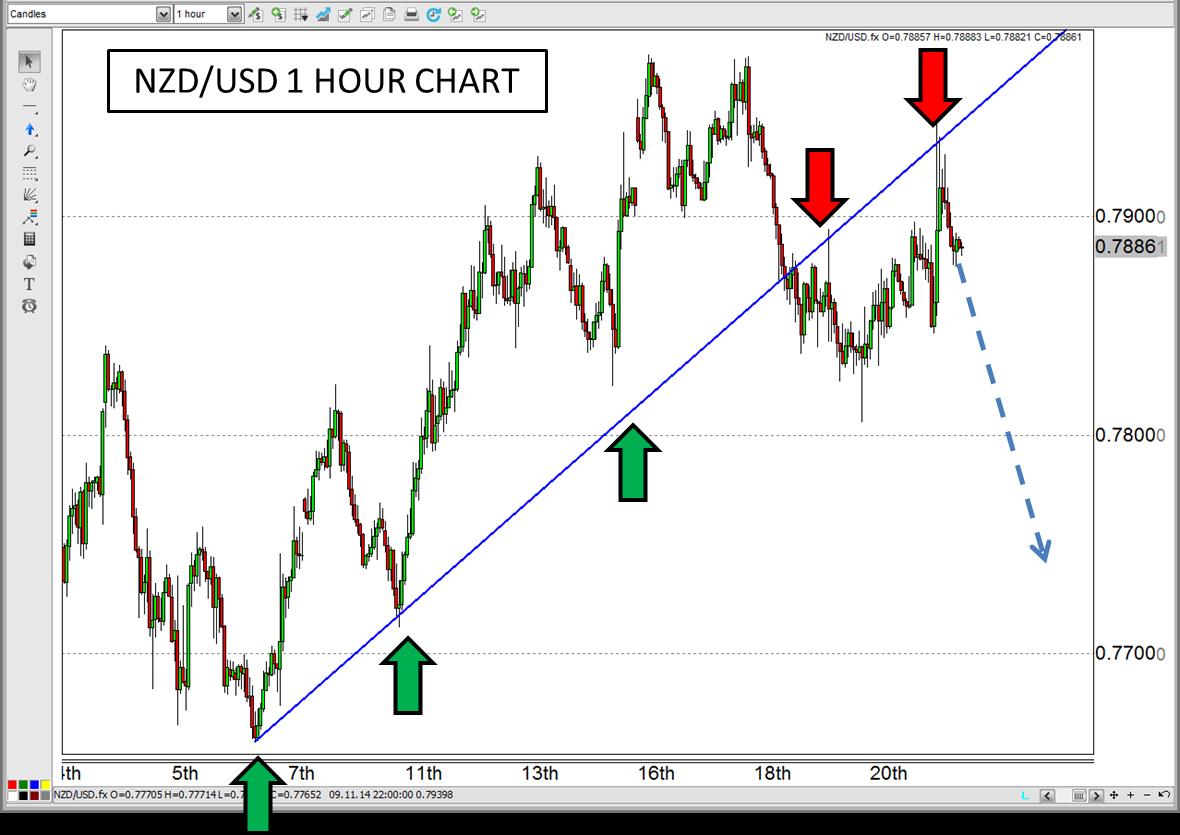
For the first half of November, the NZD/USD was trending higher and following a rather consistent trend line upward, but that support was broken earlier this week. The People’s Bank of China Interest Rate cut in the latter parts of the week gave the NZD and AUD some legs, but it may be running out of steam as the PBoC is notorious for acting before the bad news of economic strife hits the news wires. Fortuitously though, that NZD/USD rally hit the previous trend line support which acted as resistance and shoved it back down and may be a catalyst for a further fall.
Figure 2:
Potential Bullish Gartley Pattern
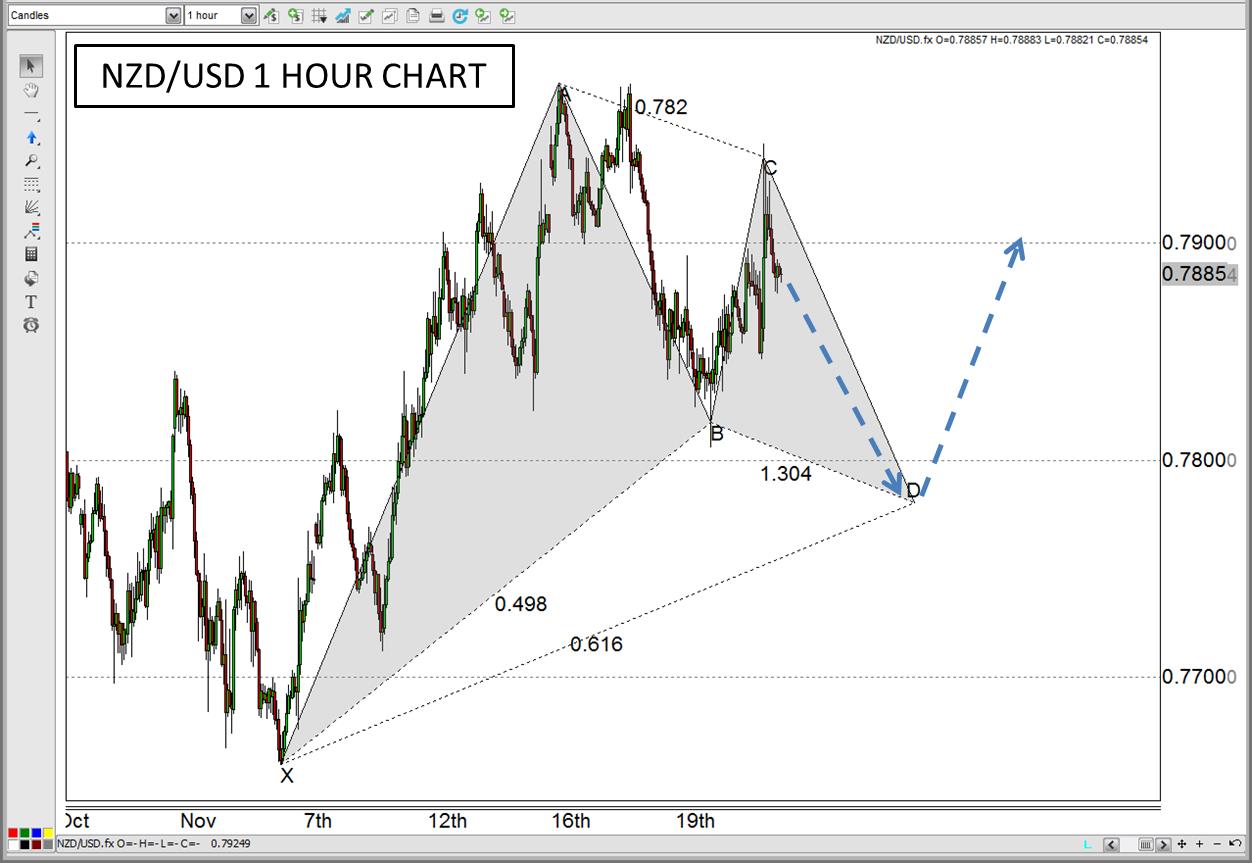
Perhaps it may be a little premature in calling this one, but if this currency were to fall a bit further throughout the first part of or the entirety of next week, it would form a very visually compelling Bullish Gartley Pattern. If said Gartley Pattern were to come to fruition, it would be a bullish sign thereafter, but the NZD/USD would have to fall first to set it up.
Figure 3:
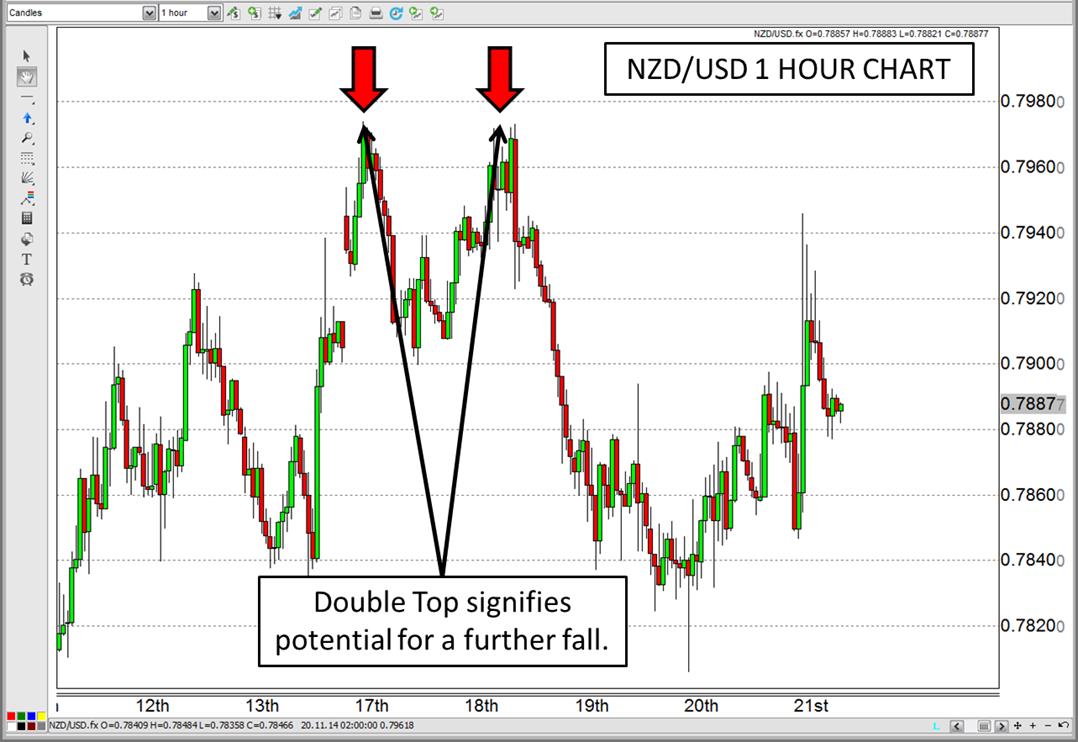
Clearly Defined Double Top
Earlier this week, the NZD/USD formed a very distictive and easily spotted Double Top pattern, which many technical analysts like to point out signals a coming fall. Now, the mere fact that I’m pointing it out and that it’s widely used may be a reason in and of itself that people will discredit it, but it’s there nonetheless.
Figure 4:
Potential Head and Shoulders Pattern
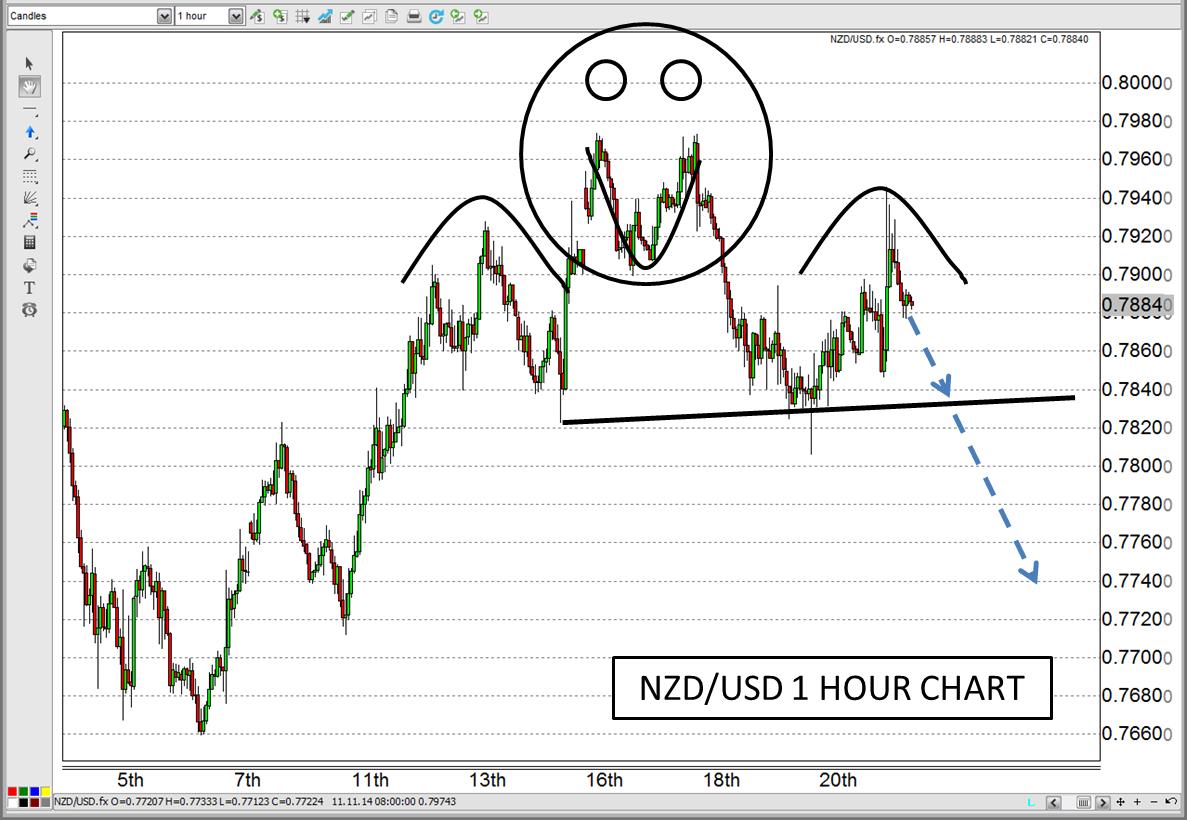
In the same vein as number 3 on this list, there is a potential Head and Shoulders Pattern forming that hasn’t quite gotten to the decision point yet, but is well on it’s way. You could say I got a little carried away with this drawing (Figure 5), but I believe it succinctly illustrates my point.
Figure 5:
