After tagging 0.812 during early European trading hours yesterday, NZD/USD pushed lower during early US session. Part of the sell-off is an affirmation of the consolidation ceiling, but a large part can be attributed to the stronger US Consumer Confidence which push USD stronger. The resulting selling price action formed the descending Channel that has been in play for the past 12 hours.
Hourly Chart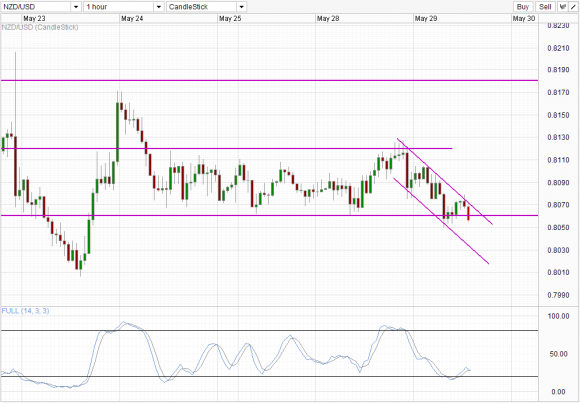 NZD/USD_1" title="NZD/USD_1" width="580" height="403">
Price has respected both the Channel top and bottom, with the latest bounce around 0.806 lining up nicely with a rebound in Stochastic readings during early Asian session today. Price has since tagged Channel top and is in the midst of trading lower, with Channel bottom as a target. If bears have their way, 0.806 will be broken and the next level of support will be around 0.801, in the form of 23rd May swing low. Stochastic readings agrees with a bearish outlook despite barely off the Oversold block. Readings are currently pointing lower after forming an interim peak.
Now the question is whether current price action constitute a breakout of the Consolidation region. It is hard to say as price has managed to fakeout once just a few hours ago, and may well do it again this time. If the fakeout is confirmed, it is likely that price will be trading above the Channel Top, which would invalidate current descending channel and add more conviction that price will be able to push back towards 0.812. However, argument against a fakeout can be made as well, as the supposed fakeout a few hours ago is part of the downtrend that is still ongoing, and hence it is hard to label it a fakeout when the initial move isn’t even over. With this in mind, traders may wish to seek further confirmations. Bulls may wish to look at 0.807 while bears may wish to focus on 0.805 and see price actions around these levels for further references.
Weekly Chart
Weekly Chart shows a strong multi-year uptrend with current price action moving towards the rising trendline which can be traced all the way back to 2008. A breakout on the short-term chart will also be seen on the weekly chart of a breakout, with the next objective being the rising trendline. Bulls may look at 0.818 and also the descending trendline for possible resistance levels. Stochastic readings are within the Oversold region but there is still hairline difference between current levels and the previous trough, which enhances the strength of the rising trendline support.
There is also a possibility of further bearish breakthrough though, with last week’s Spinning Top candlestick potentially being a reversal pattern or a point of inflexion, which would suggest that price may produce yet another leg of bearish acceleration similar to the 2 weeks which saw price falling from 0.855 to 0.806.
Fundamentally, USD strength may not go away so soon, hence any bullish factors from NZD/USD has to come from NZD which is found wanting at the moment. With RBNZ bent on weakening Kiwi and Fed being unsure when to stop QE3, the direction of NZD/USD will remain bearish unless US stock markets start to crash. Unfortunately for bulls, yields are actually climbing, not descending, which suggest that risk appetite remains strong and a total capitulation may not be coming anytime soon. We can’t predict the future, but certainly all these bearish factors favor a lower NZD/USD as opposed to a scenario where price can climb back to its former glory of 0.85 in June.
- English (UK)
- English (India)
- English (Canada)
- English (Australia)
- English (South Africa)
- English (Philippines)
- English (Nigeria)
- Deutsch
- Español (España)
- Español (México)
- Français
- Italiano
- Nederlands
- Português (Portugal)
- Polski
- Português (Brasil)
- Русский
- Türkçe
- العربية
- Ελληνικά
- Svenska
- Suomi
- עברית
- 日本語
- 한국어
- 简体中文
- 繁體中文
- Bahasa Indonesia
- Bahasa Melayu
- ไทย
- Tiếng Việt
- हिंदी
NZD/USD: 0.806/0.812 Consolidation Threatened
Published 05/29/2013, 07:04 AM
Updated 07/09/2023, 06:31 AM
NZD/USD: 0.806/0.812 Consolidation Threatened
Latest comments
Loading next article…
Install Our App
Risk Disclosure: Trading in financial instruments and/or cryptocurrencies involves high risks including the risk of losing some, or all, of your investment amount, and may not be suitable for all investors. Prices of cryptocurrencies are extremely volatile and may be affected by external factors such as financial, regulatory or political events. Trading on margin increases the financial risks.
Before deciding to trade in financial instrument or cryptocurrencies you should be fully informed of the risks and costs associated with trading the financial markets, carefully consider your investment objectives, level of experience, and risk appetite, and seek professional advice where needed.
Fusion Media would like to remind you that the data contained in this website is not necessarily real-time nor accurate. The data and prices on the website are not necessarily provided by any market or exchange, but may be provided by market makers, and so prices may not be accurate and may differ from the actual price at any given market, meaning prices are indicative and not appropriate for trading purposes. Fusion Media and any provider of the data contained in this website will not accept liability for any loss or damage as a result of your trading, or your reliance on the information contained within this website.
It is prohibited to use, store, reproduce, display, modify, transmit or distribute the data contained in this website without the explicit prior written permission of Fusion Media and/or the data provider. All intellectual property rights are reserved by the providers and/or the exchange providing the data contained in this website.
Fusion Media may be compensated by the advertisers that appear on the website, based on your interaction with the advertisements or advertisers.
© 2007-2024 - Fusion Media Limited. All Rights Reserved.