The New Zealand Dollar and the Japanese Yen make an unlikely attractive pair, but there is certainly a lot to be said about the strong trending market that is in play and the historic trend that can be easily seen on the charts.
For an overall Q1 fundamental and technical review of the NZD, the JPY and other major currencies, do have a look at the exclusive Quarterly Review brought to you by our Research team. This is an in-depth study of the markets over the past quarter, covering various currencies and commodities and will help serious traders with market forecasts and trading decisions in the next quarter.
Download the Quarterly Review here:

Source: Blackwell Trader
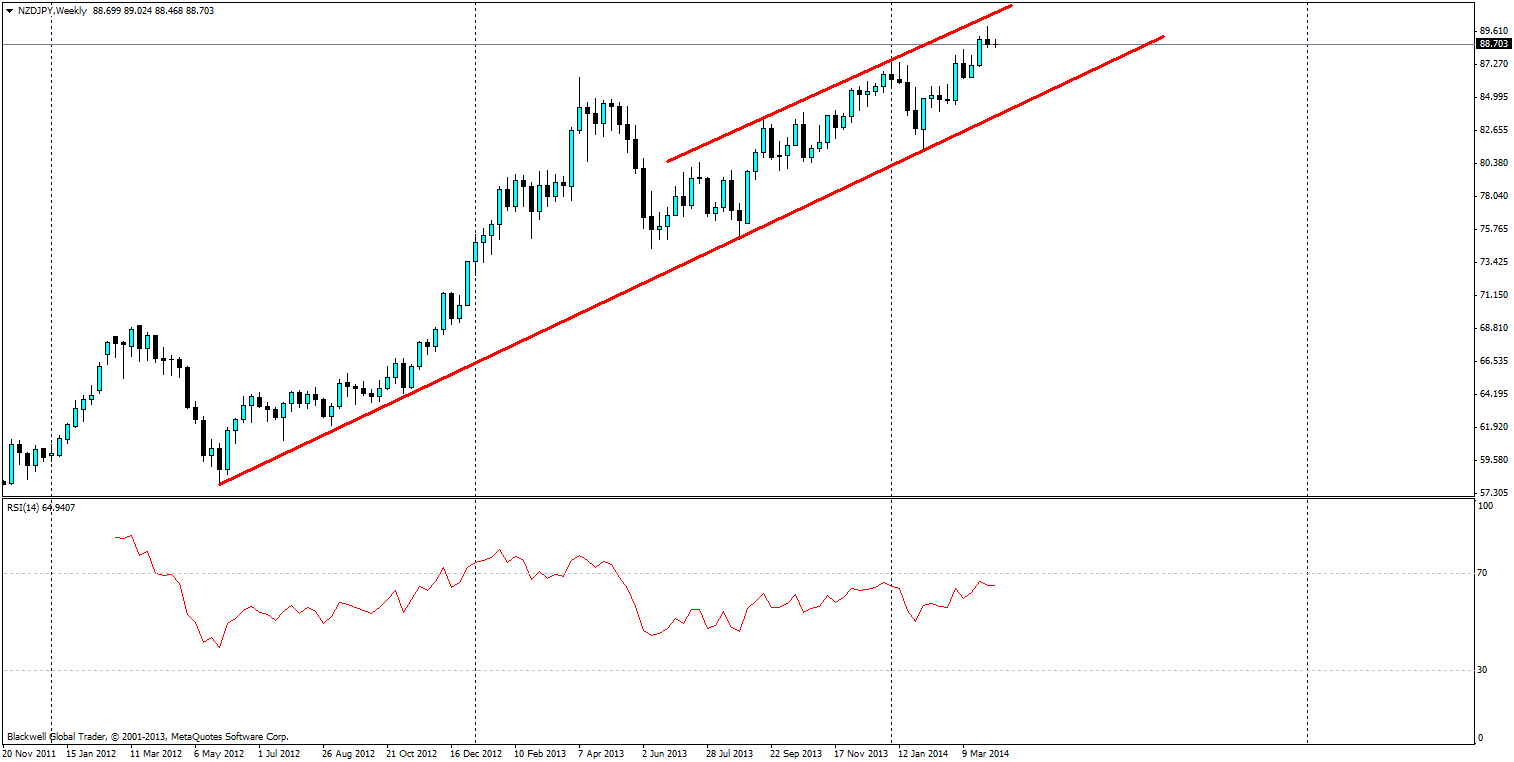
NZD/JPY spent the last two years trending strongly up the charts. It can be clearly seen that in the last year alone,a channel has started to form on the weekly chart and we have seen consistent growth in the value of the NZD relative to the Yen on the back of a booming Kiwi economy.
The Japanese economy has struggled somewhat at times but continues to seek a lower valuation for its Yen as it tries to remain competitive in the Asian market scene. This has also been led in part by Kuroda, who is aggressive when it comes to monetary policy and fixing the Japanese stagflation that has afflicted Japan for some time.

Source: Bloomberg (JP trade weighted index v NZ trade weighted index)
As can be seen on the graph, the trade-weighted indexes of both countries show a clear divergence and it seems unlikely to change in the near future, especially since the NZ economy has been looking increasingly stronger as demonstrated yet again with business confidence at 52 on the business confidence index – the highest it has been in 14 years. Future forecasts for most of NZ’s economic indicators are similarly rosey, with more forecasts pointing to further highs, which is a stark contrast when looking at the Japanese economy.

Source: Bloomberg (Japan Account Balance)
Today’s account balance data also showed a solid recovery of the Japanese economy as imports slacked off heavily with the sales tax coming into play. Additionally, with imports likely to be weaker over the next few months and exports tipped to increase, we could certainly see a resurging account balance for the Japanese economy.

Source: Blackwell Trader
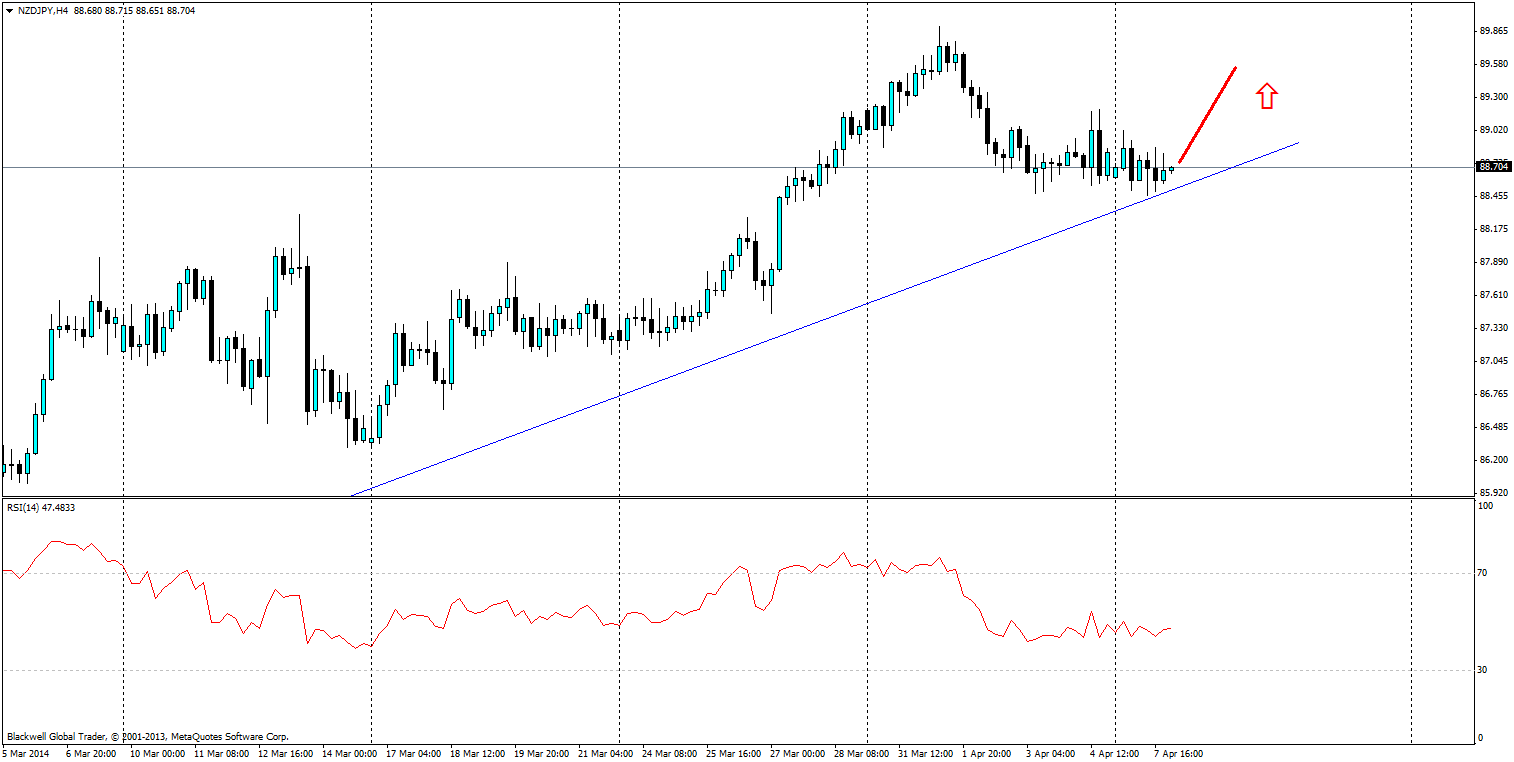
The 4 hour chart provides a much better view of the recent NZD/JPY moves and it looks unlikely that we will see further movements lower. While moves have been moving horizontally on the chart and slightly downward, the trend line in play from the daily chart is still strong, and the Yen is unlikely to crash through – especially against the New Zealand dollar.

Source: Blackwell Trader
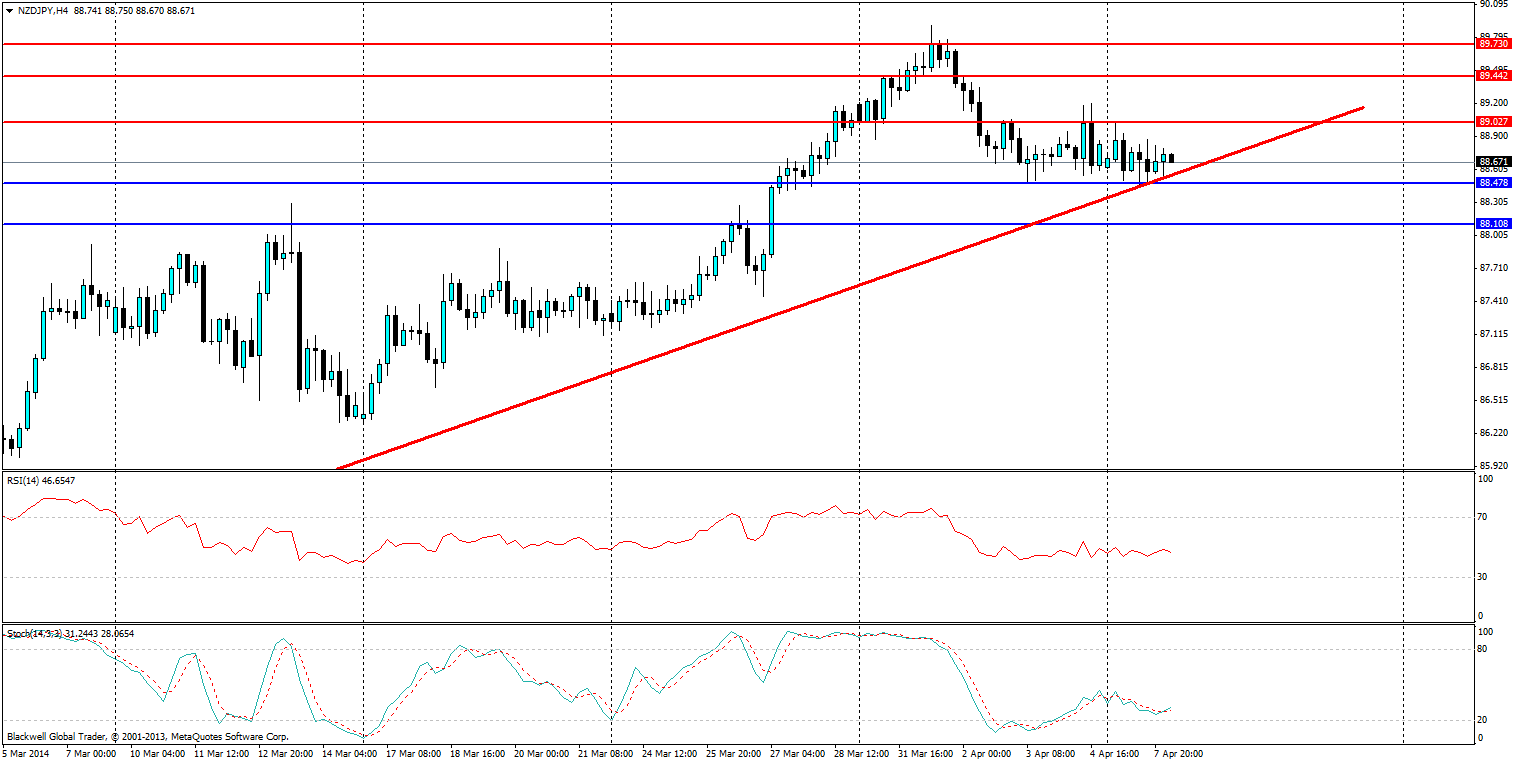
Resistance levels are looking strong at 89.027, 89.442 and 89.730; with the 89.730 price level the one to beat for the NZDJPY cross. Support levels can be found at 88.478 and 88.108, but it's more than likely that the trend line will just act as dynamic support for any further rises in the pair.
While the Yen is hotly talked about in the global economy, it seems to be lacking a lot of punch on the charts and the NZ currency is currently the best performing of them all on a trade weighted scale. Going forward its likely we will see further highs against the Yen as it continues to weaken under pressure from the Bank of Japan and Shinzo Abe.
