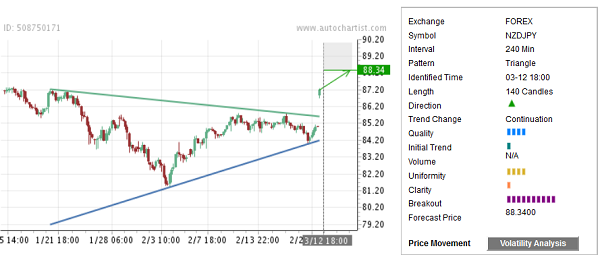
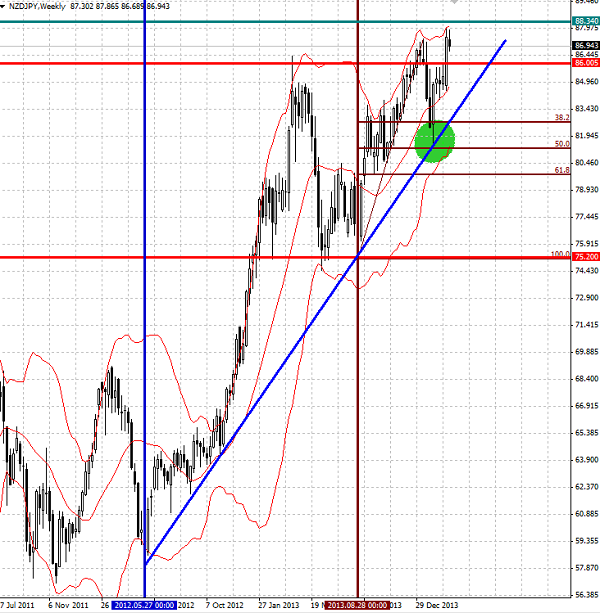
NZD/JPY recently broke the extended 4-hour Triangle chart pattern that was previously identified by Autochartist. The pair is set to rise to the target level 88.34 in the nearest time. This Triangle breakout continues the strong uptrend that can be seen on the daily NZD/JPY charts. More specifically it follows the earlier sharp reversal from the support area lying at the intersection of the weekly support trendline from the middle of 2012 and the 50% Fibonacci Correction of the preceding upward price impulse from last August (as you can see on the second chart below). The strength of this breakout is measured by Autochartist at the maximum, 10–bar level.
 NZD/JPY 1" title="NZD/JPY 1" height="242" width="474">
The following weekly NZD/JPY chart shows the aforementioned support zone:

