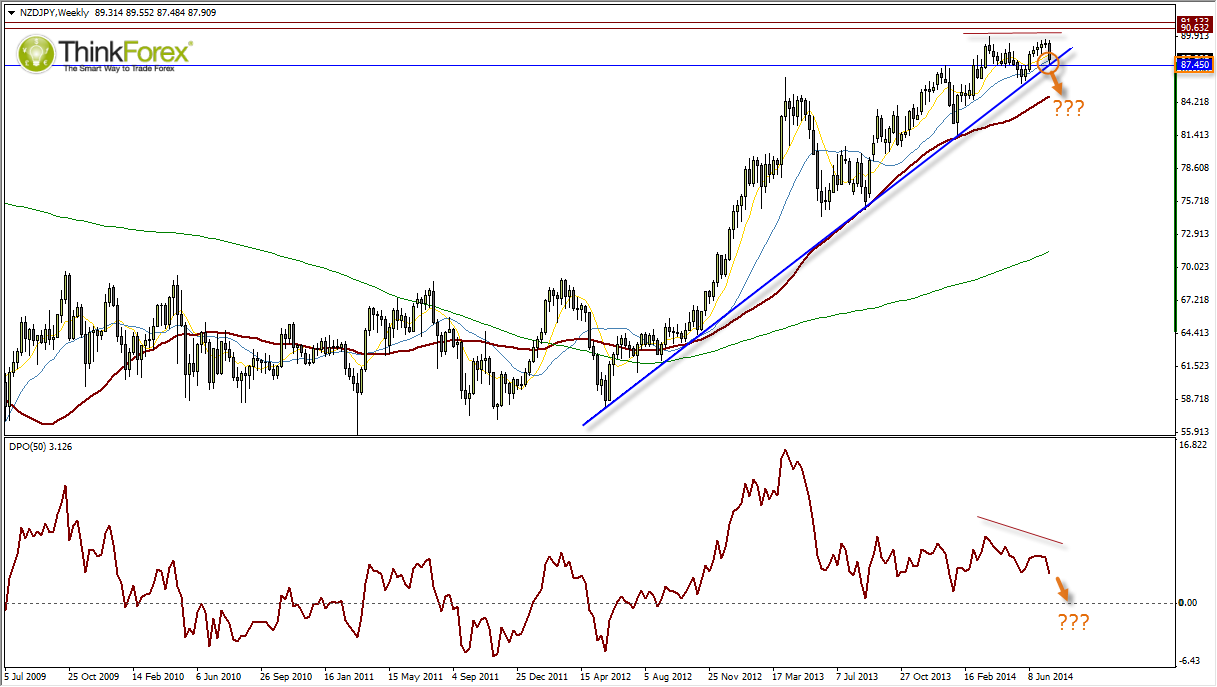
With prices on the NZD/JPY breaking several key support levels there is no better time than to zoom out again for a reminder of the larger picture.

Whilst we highlighted the potential for the market top 8 days ago, the speed in which it turned did catch me by surprise. But then this is always good sign of a top anyway. With prices breaking several key support levels there is no better time than to zoom out again for a reminder of the larger picture.
Originally the call was for price to target 90+ and whilst this has not yet been ruled out, it would be prudent to look at the counter-analysis and seek the break level we could use as confirmation.
The chart above singles out 87.45 as the level to watch for further losses on W1.
The indicator is a Detrended Price Oscillator (DPO) which simply measures the difference between close price and a 50-period MA. It can be used to assess if a market is over-extended from its moving average and for divergences, like a momentum indicator. I have highlighted the bearish divergence which has formed whilst a potential double top formation plays out. Also note that the DPO is pointing down and appears set to retrace closer to zero (which means price must retrace towards its own moving average).
Of course this is not predictive but merely a suggestion. However a break below 87.40 would be a string signal for the bears because it would break both the pivotal S/R level and the trendline from the 2012 lows.
