Investing.com’s stocks of the week
The NZD/JPY has edged lower as price action continues to appear corrective, which would require a bullish trend continuation. Perhaps we have found our swing low.

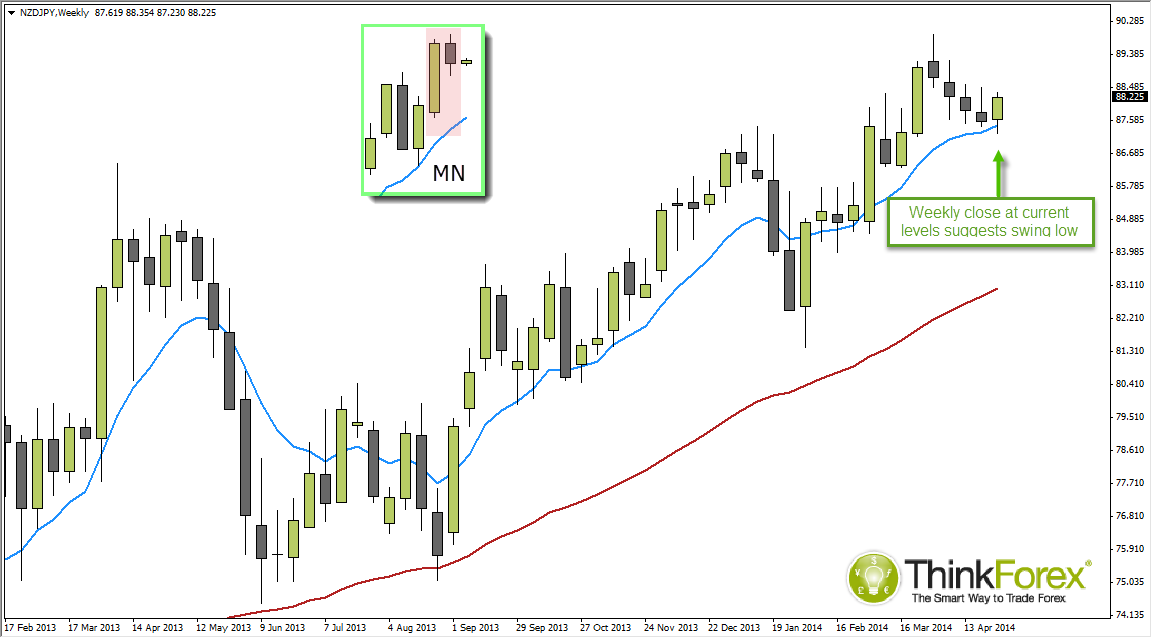
The monthly chart (inset) displays a Bearish Harami to warn of potential weakness. Price is also extended away from the 10-month sMA so we have to consider the possibility of a deeper pullback over the coming month/s. However the weekly chart could well confirm a swing low if we see a bullish close, particularly around or above current levels.
Last week closed with an Inverted Hammer to warn of near-term strength and a bullish close today would confirm the inverted hammer. Price is also respecting the 10-week sMA with cycle. Taking into account we have a disparity between Monthly and Weekly charts then we'd need to trade on the long-side cautiously, as any gains could simply be part of a correction of a larger move down on the monthly chart.

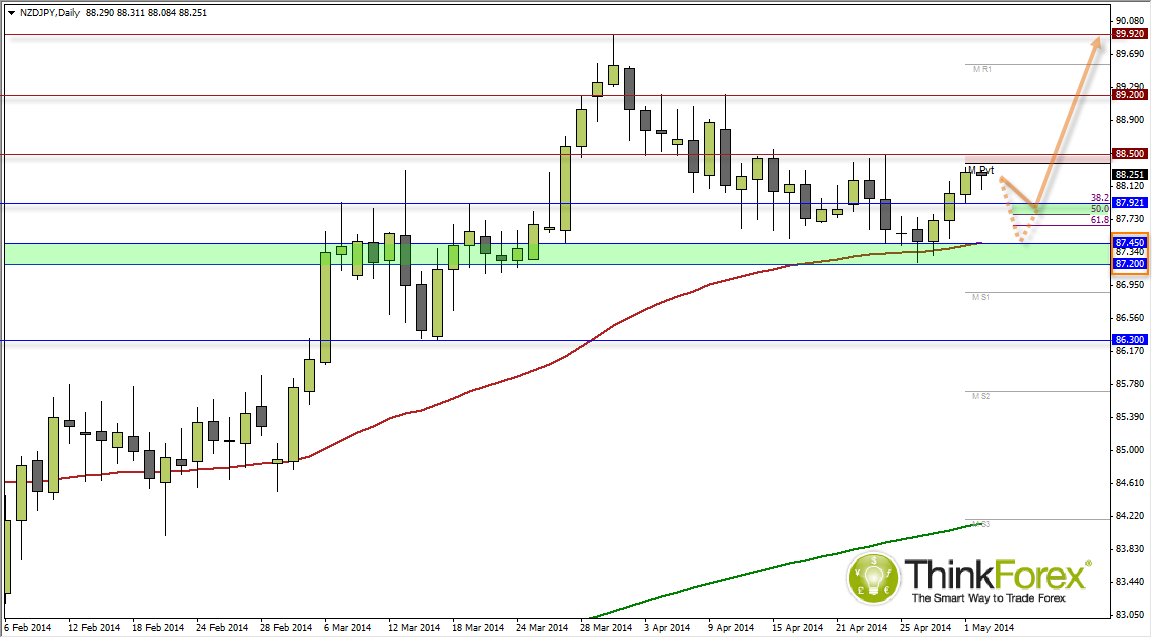
Price trades beneath the Monthly pivot and 88.50 resistances, so I suspect we will close the week below this level. Also note at current levels a close would present a Hanging Man reversal to warn of near-term weakness. If this is the case then I favour a pullback towards 87.90 early next week which may provide buy signals as the week progresses. The next confluence area of support is around 87.20-45 (swing low and 50 day eMA) where bullish setups on lower timeframes could also be considered.
As long as we remain above the weekly low at 87.20 the near-term bias remains bullish in line with the weekly trend, but remember the Monthly chart exhibits potential for a deeper retracement further down the line. For this reason I am limiting the target to the 89.92 highs, where a break above will invalidate the Bearish Harami pattern on the Monthly chart.
