Investing.com’s stocks of the week
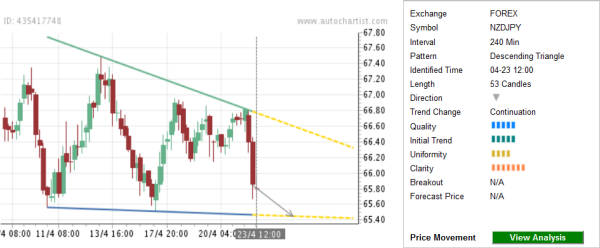
NZD/JPY continues to fall inside the Clear Descending Triangle chart pattern on the 4-hour charts. The overall quality of this chart pattern is measured at the 5-bar level as a result of the following values of the individual quality indicators: average Initial Trend (rated at the 5-bar level), lower Uniformity (4 bars) and significant Clarity (7 bars). This chart pattern continues the preceding sharp downward price impulse from the major long-term resistance at 69.00. The pair is expected to fall further in the nearest time, which is also indicated by the PowerStats analysis shown below.

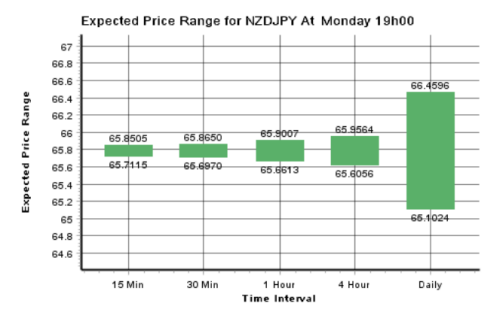
As can be seen from the following PowerStats chart, the upper boundary of the daily Expected Price Range (EPR) for NZD/JPY for tomorrow (66.4596) stands below the upper resistance trend line of the above Descending Triangle, while the lower boundary of the EPR (65.1024) stands below the lower support trend line. Both of these facts heighten the likelihood of further losses for this currency pair tomorrow.


As can be seen from the following PowerStats chart, the upper boundary of the daily Expected Price Range (EPR) for NZD/JPY for tomorrow (66.4596) stands below the upper resistance trend line of the above Descending Triangle, while the lower boundary of the EPR (65.1024) stands below the lower support trend line. Both of these facts heighten the likelihood of further losses for this currency pair tomorrow.

