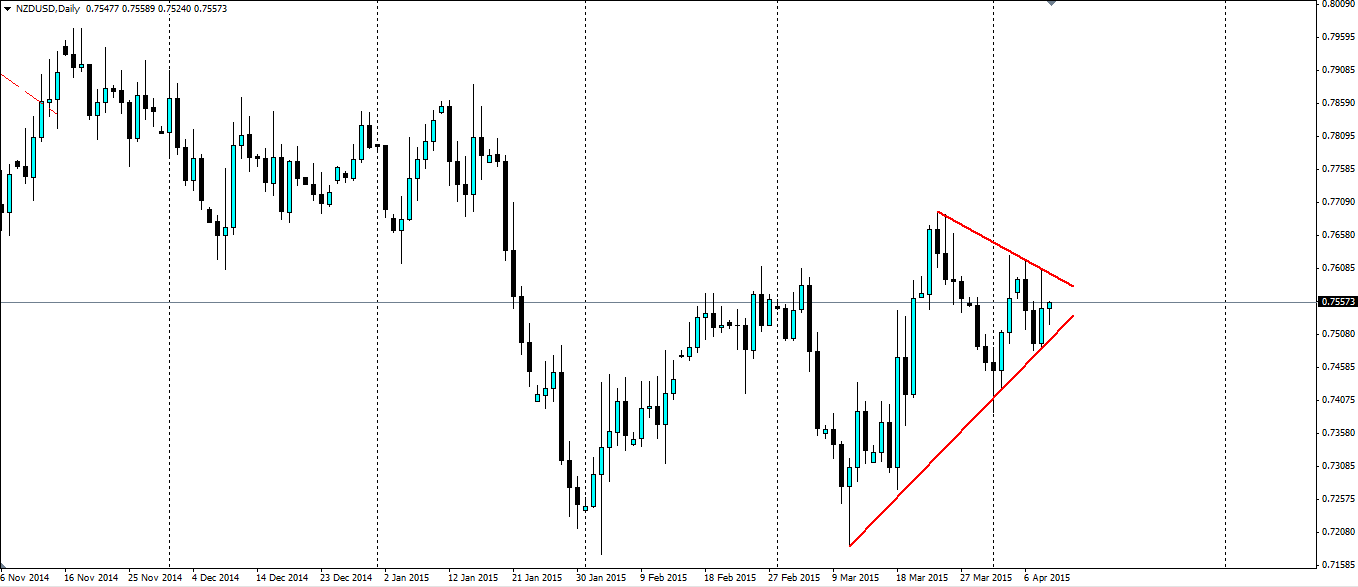
The New Zealand dollar is consolidating into a nice pennant shape on the daily chart as it bounces between the recent 4 year lows and the solid resistance at the 76 cent mark.

Source: Blackwell Trader
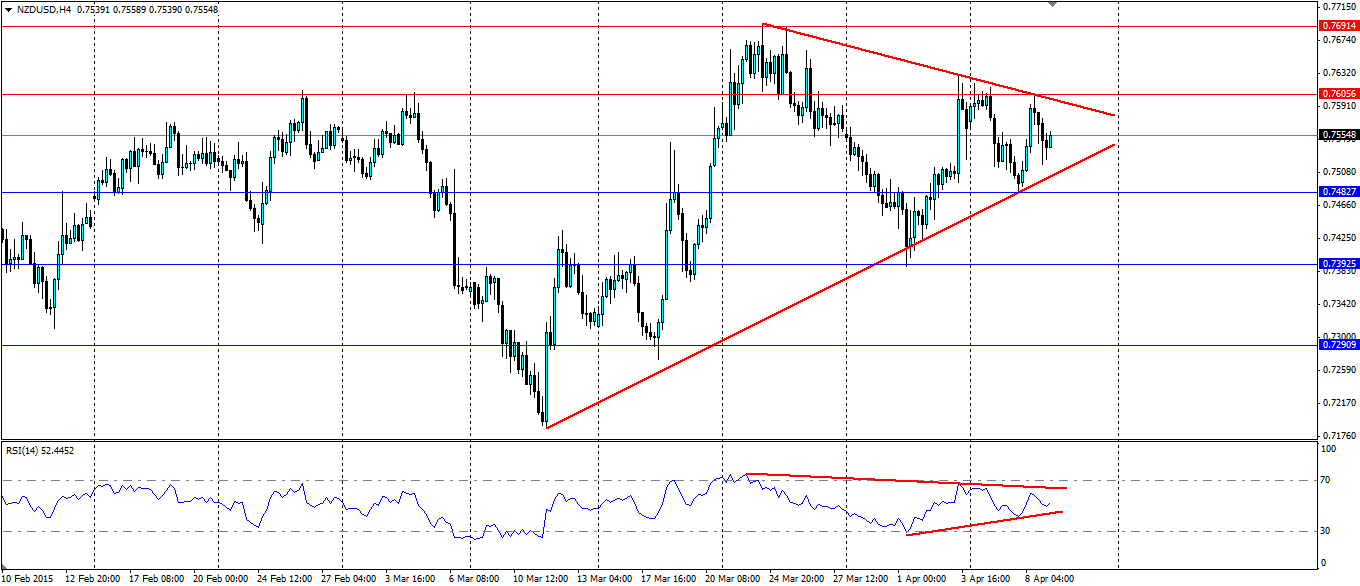
There is little news out for the kiwi dollar over the next week and a half, and news from the US is not expected to be major over the same period, so we can expect technicals to play a large part in the movements of the NZD/USD pair. The latest Nonfarm result and the FOMC meeting minutes have ensured the kiwi has been volatile, but the highs are getting lower and the lows higher, indicating a squeeze between the bulls and the bears that is likely to lead to a breakout. This can also be seen in the RSI on the below H4 chart, which is consolidating along with the price.
We could see a bit more consolidation from this pair which will provide an opportunity for traders to play off the trend lines as they act as dynamic support. This play will become riskier as we get to the pointy end of the shape as the risk/reward ratio will diminish and the likelihood of a breakout will increase.
The kiwi has remained within the range for several months now and so could see a downside breakout that will maintain the range. Alternatively, the large double bottom that has formed on the above daily chart could indicate an upside breakout is on the cards. That will take the through the recent highs and back towards the resistance at 0.7850.

Source: Blackwell Trader
Either way, a breakout is inevitable and could see a rather large movement. Look for support to be found at 0.7482, 0.7392 and 0.7290 if we see a bearish breakout. If we see a bullish breakout, watch for resistance to be found at 0.7605, 0.7691 and the aforementioned resistance at 0.7850.
A pennant pattern is forming on the daily chart for the Kiwi dollar that indicates a consolidation. A breakout is inevitable, but the direction is up for debate. Either way it will provide opportunities.
