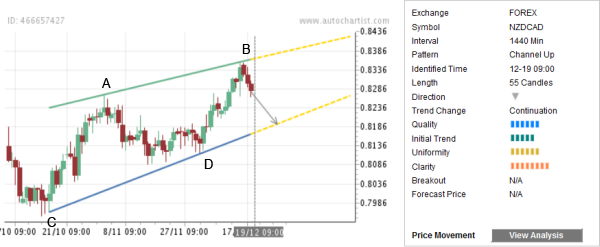
NZD/CAD recently reversed down from the upper resistance trendline of the Up Channel chart pattern identified by Autochartist on the daily charts. Autochartist rates the overall Quality of this chart pattern at the 6 bar level as a result of the average Initial Trend (5 bars), higher Uniformity (6 bars) and near maximum Clarity (8 bars).
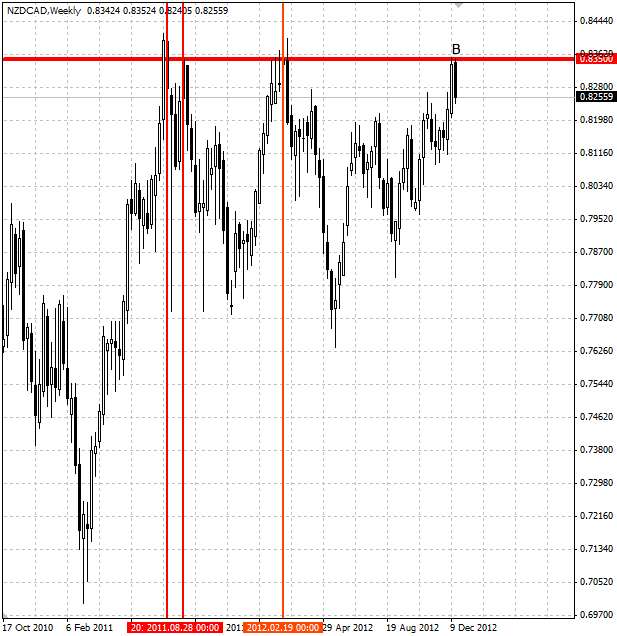
The top of this Up Channel (point B on the chart below) formed when the pair reversed sharply down from the strong long-term resistance level 0.8350 (which had previously reversed NZD/CAD down in July and September of 2011, as well as in February of 2012, as is shown on the second chart below). The pair is expected to fall further toward the lower support trendline of this Up Channel.

The weekly NZD/CAD chart below shows the previous price action close to the long-term resistance level 0.8350:

The top of this Up Channel (point B on the chart below) formed when the pair reversed sharply down from the strong long-term resistance level 0.8350 (which had previously reversed NZD/CAD down in July and September of 2011, as well as in February of 2012, as is shown on the second chart below). The pair is expected to fall further toward the lower support trendline of this Up Channel.

The weekly NZD/CAD chart below shows the previous price action close to the long-term resistance level 0.8350:

