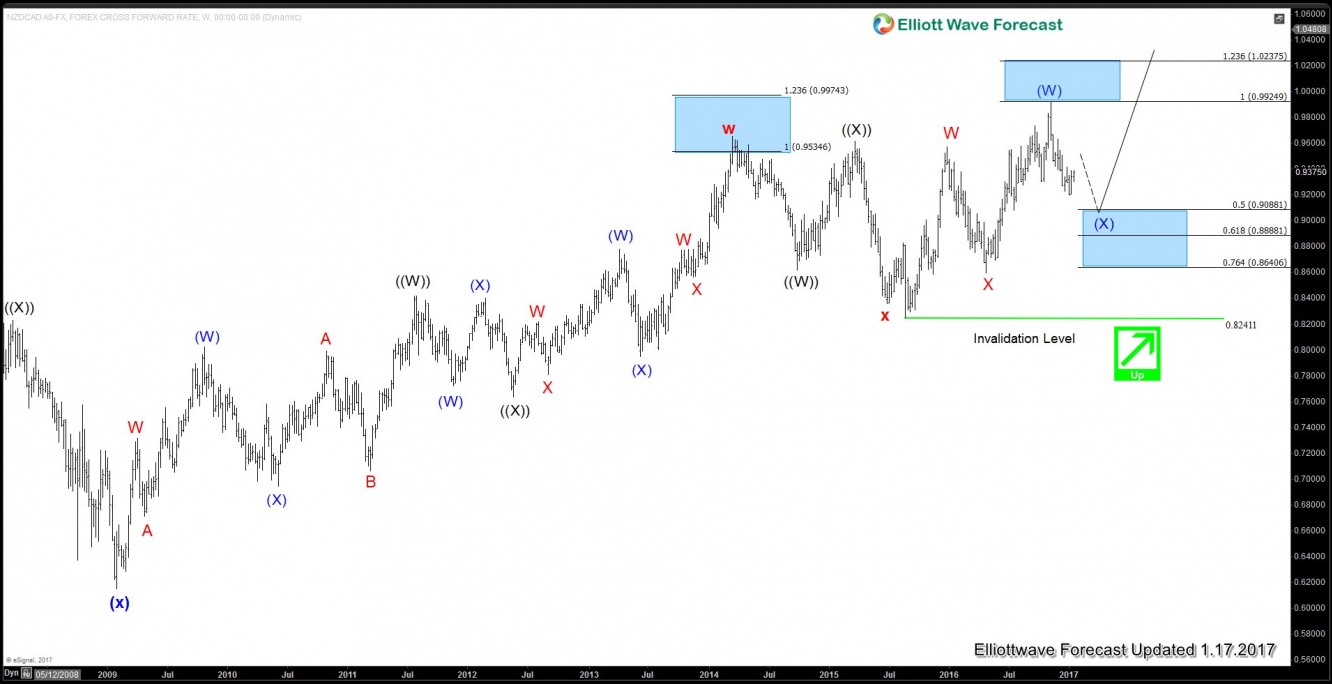
NZD/CAD is showing a bullish sequence in the weekly time frame with the break above the previous peak at 3/17/2014, suggesting that further upside to a new high is favored. Pair still has a scope to extend lower in wave (X) to correct the rally from 8/24/2015 low (0.824) before the next bullish leg starts, provided that pivot at 8/24/2015 low (0.824) stays intact.
Weekly Chart:

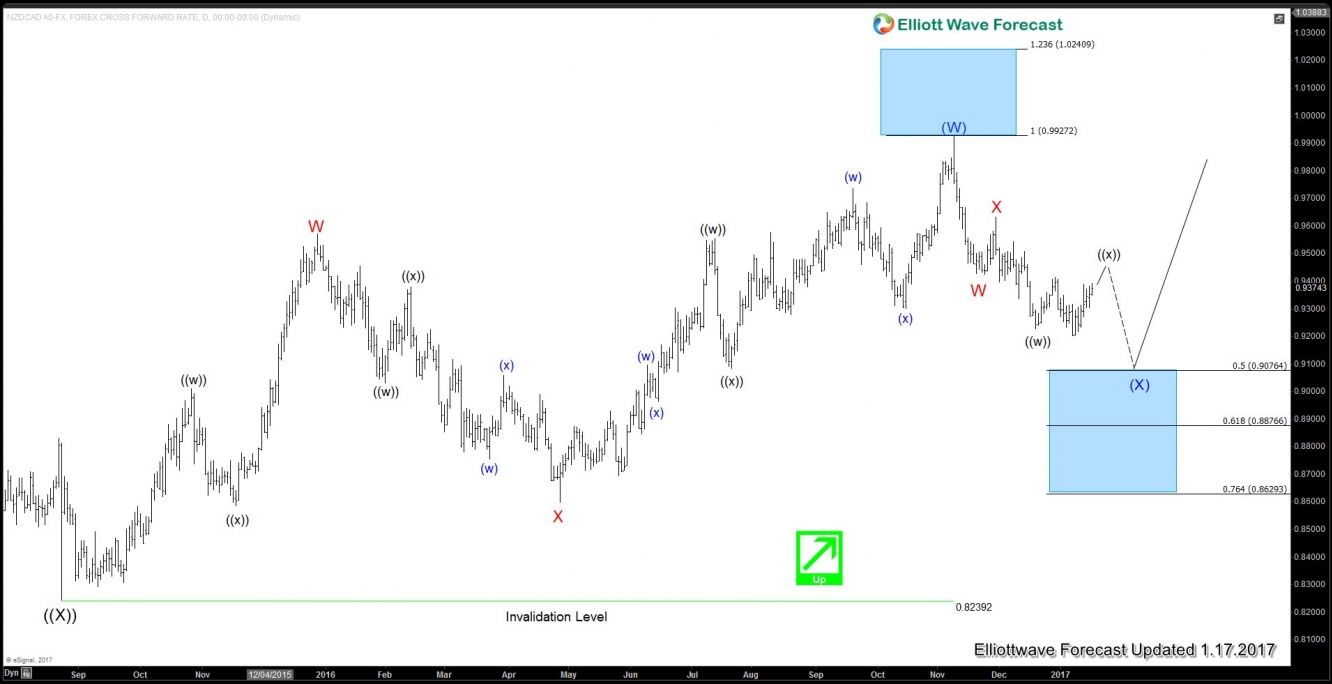
Daily chart provides scope for the pair to extend lower in wave (X) pullback to correct the rally from 8/24/2015 low (0.824). The structure of the pullback is unfolding as a double three where wave W ended at 0.942 and wave X ended at 0.963. Wave Y is in progress towards 0.887 – 0.908 area, then as far as pivot at 8/24/2015 low (0.824) stays intact, expect pair to resume higher or at least bounce in 3 waves.
Daily Chart:

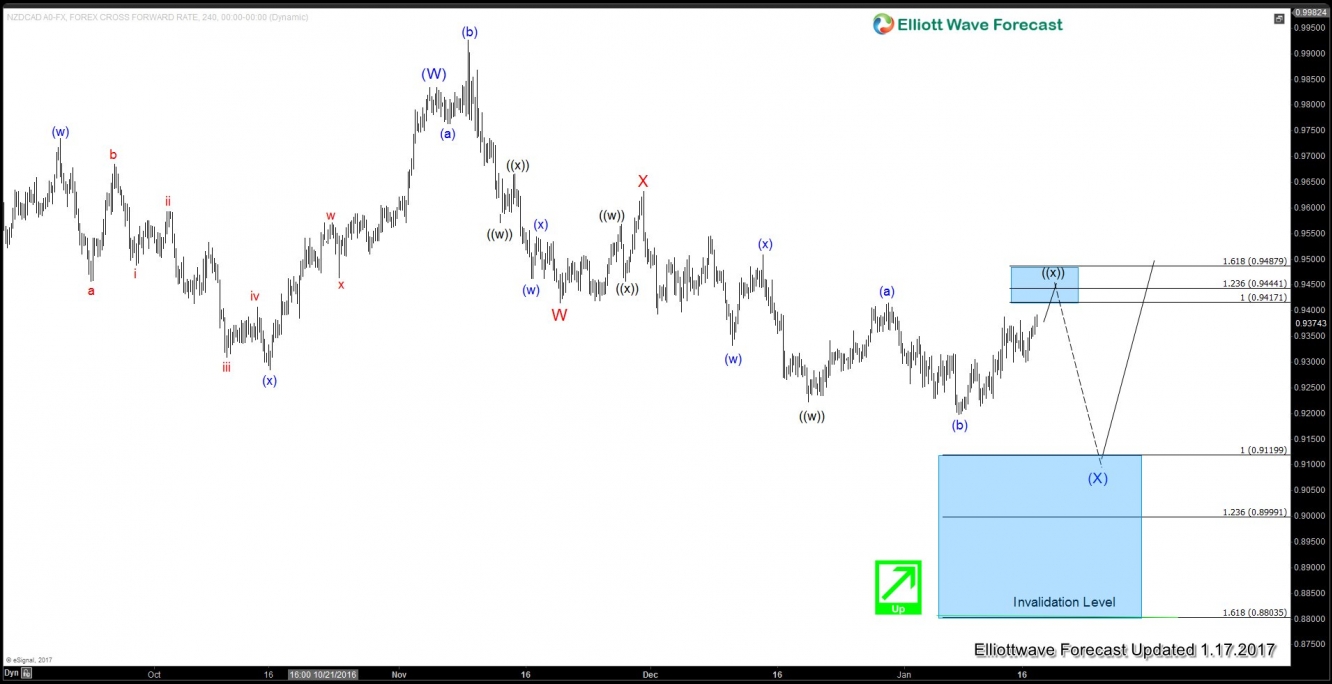
Pair looks to be doing wave ((x)) correction as a flat towards 0.9417 – 0.9488 area before turning lower to a new low or at least pullback in 3 waves. There’s still scope for the pair to extend lower in wave (X) towards 0.90 – 0.902 area before ending cycle from 11/9 peak and see the pair resumes higher or bounce in 3 waves. We expect buyers to appear in the 0.9 – 0.912 area for a new bullish cycle or at least a larger 3 waves bounce.
4H Chart :

