
NZD/CAD is moving inside the Rectangle chart pattern identified on the 4-hour charts. The overall quality of this chart pattern is rated at the 6-bar level as a result of the sharp Initial Trend (measured at the 9-bar level), average Uniformity (5 bars) and lower Clarity (4 bars).
This chart pattern continues the strong preceding downward price impulse from the major long-term level of resistance 0.8400 (which has previously reversed the pair sharply down over the last few years as well as at the end of the last month, as is shown on the third chart below). The pair is expected to fall further in the direction of the lower support trendline of this Rectangle.

All of the daily Expected Price range for NZD/CAD for tomorrow (from 0.8207 to 0.8101) stands below the upper resistance trendline of the above Rectangle, which heightens the likelihood that this currency pair will continue to decline tomorrow.

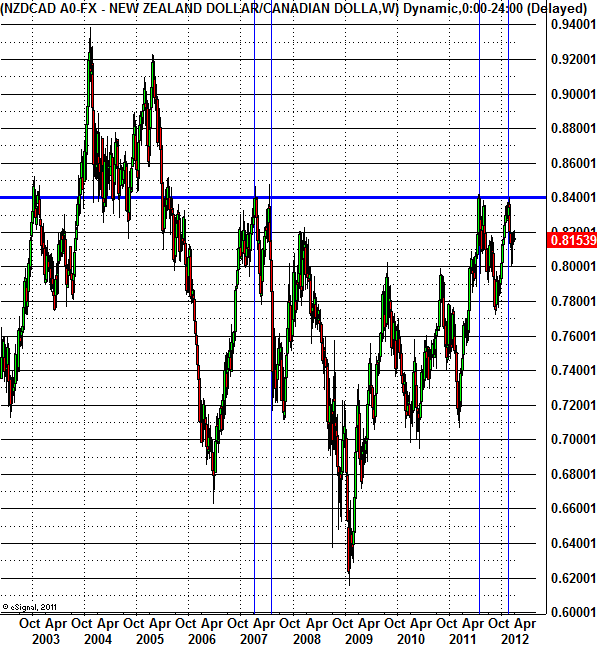
The following weekly NZD/CAD chart shows the previous price action close to the major level of resistance 0.8400.
 NZD/CAD CHART" title="NZD/CAD CHART" width="600" height="646" />
This chart pattern continues the strong preceding downward price impulse from the major long-term level of resistance 0.8400 (which has previously reversed the pair sharply down over the last few years as well as at the end of the last month, as is shown on the third chart below). The pair is expected to fall further in the direction of the lower support trendline of this Rectangle.
All of the daily Expected Price range for NZD/CAD for tomorrow (from 0.8207 to 0.8101) stands below the upper resistance trendline of the above Rectangle, which heightens the likelihood that this currency pair will continue to decline tomorrow.
The following weekly NZD/CAD chart shows the previous price action close to the major level of resistance 0.8400.
NZD/CAD CHART" title="NZD/CAD CHART" width="600" height="646" />