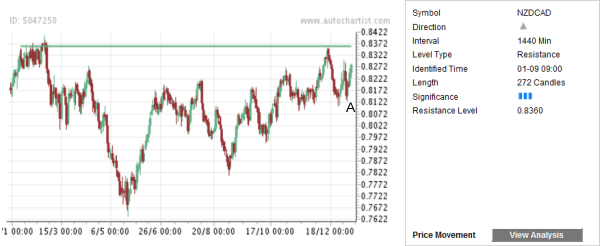
Autochartist recently identified the horizontal Key Resistance Level 0.8360 on the daily NZD/CAD charts. The length of this Key Level is equal to 272 candles. Autochartist rates the Significance of this Key Level at the 3 bar level as a result of the three downward price reversals from this resistance.
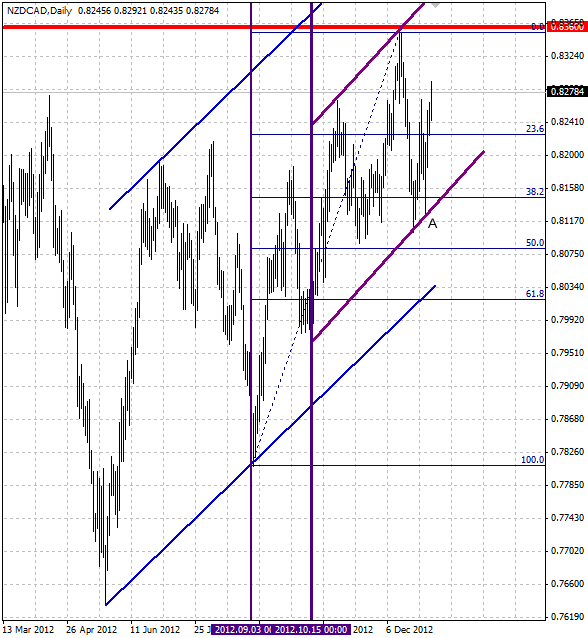
The pair has previously reversed up (at point A) from the support area made out of the 38,2% Fibonacci Retracement of the previous upward price impulse from September of 2012 and the support trend line of the upward price channel from October (as can be seen on the second chart below). The pair is set to rise further toward the Key Resistance 0.8360 – in line with the predominant uptrend visible on the weekly NZD/CAD charts.

The daily NZD/CAD chart below shows the aforementioned support levels:

The pair has previously reversed up (at point A) from the support area made out of the 38,2% Fibonacci Retracement of the previous upward price impulse from September of 2012 and the support trend line of the upward price channel from October (as can be seen on the second chart below). The pair is set to rise further toward the Key Resistance 0.8360 – in line with the predominant uptrend visible on the weekly NZD/CAD charts.

The daily NZD/CAD chart below shows the aforementioned support levels:

