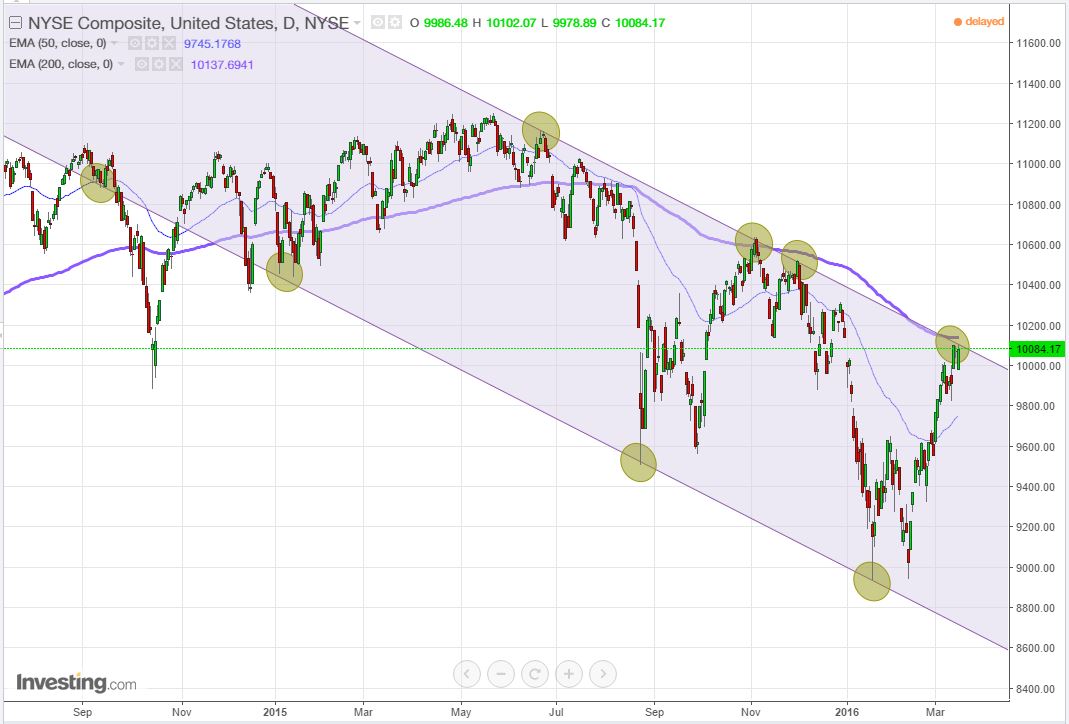
Is it a bull market or bear market?
A major confluence has formed on the daily NYSE Composite chart where Wednesdys high meets double resistance at the top of a bear channel and meets the 200 EMA.
Argument for a bear market
Unless there is some fantastic news that will propel price action through resistance, I expect prices to pull back, churn sideways forming a smaller bear flag that may ambulate along resistance over the next two months before breaking down to retest the lows of the channel.
Argument for a bull market
Interpreting the chart in a different way I'm going to contradict the previous paragraph and argue for a bull market. The entire 'Bear Channel' shown in the chart below can be interpreted as a massive bull flag that is about to break out to the up-side as part of a mega bull market that began in 2009. Any confirmed breakout through resistance over the next few months may confirm a bull market continuation.
How do you interpret this chart? Is it a mega bull flag or evidence of a bear market?
See it for yourself and tell me what you think.
