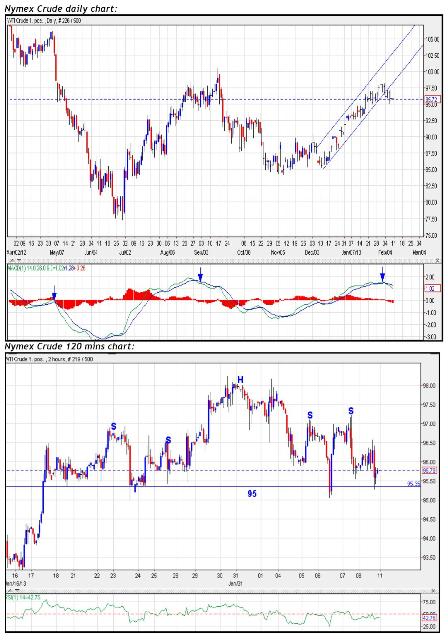
As shown in daily chart of Nymex Crude, in the last week prices continued to sustain below the previous high of 98, breached the rising channel on downside for first time since 85 levels and repeatedly for four trading session it has moved below this channel. We can observe in 120 min chart, prices have formed reversal pattern i.e. Head and shoulder (H&S) whose neckline comes near the strong support of 95.
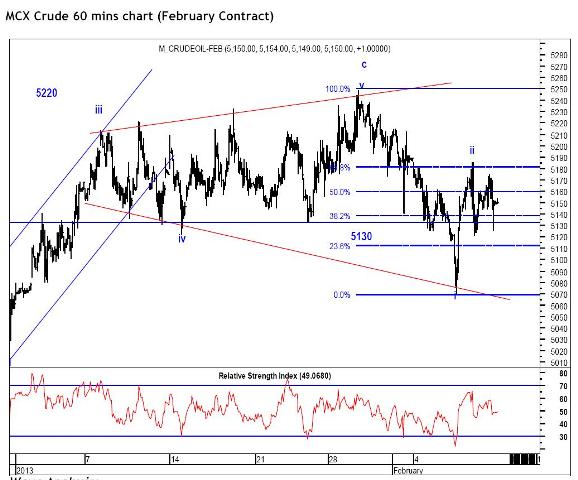
Momentum indicator MACD of 14 days (marked in green color) has crossed signal line from above shown by blue arrow. Earlier two times MACD crossed the signal line and then we have observed a fall in Nymex Crude. Altogether, indicates the negativity in this commodity. Decisive move below 95 will provide the first negative confirmation and indicates that top is in place and prices can move lower till 93.50/93 levels. As shown above in 60 mins chart, after taking support of sloping trend-line of the expanding pattern prices have retraced 61.8% of the previous down move from 5250-5070 levels.
Thereafter, prices failed to sustain at higher levels and currently moving near the support of 5130/5120. As per wave perspective, price have completed impulsive move of wave c near 5250 levels and it has started the next leg on downside. At present, prices have ended wave ii near 5185 levels and moving lower in the form of wave iii. In short, as long as 5185 is intact on upside our bias is negative.
A move below 5120 will continues the previous day down move and prices can move lower till the previous low of 5070. However, move above 5185 will continue the sideways action in expanding pattern.

- English (UK)
- English (India)
- English (Canada)
- English (Australia)
- English (South Africa)
- English (Philippines)
- English (Nigeria)
- Deutsch
- Español (España)
- Español (México)
- Français
- Italiano
- Nederlands
- Português (Portugal)
- Polski
- Português (Brasil)
- Русский
- Türkçe
- العربية
- Ελληνικά
- Svenska
- Suomi
- עברית
- 日本語
- 한국어
- 简体中文
- 繁體中文
- Bahasa Indonesia
- Bahasa Melayu
- ไทย
- Tiếng Việt
- हिंदी
Nymex Crude at 93-93.5 Levels, Bearish Trend
Published 02/12/2013, 01:36 AM
Updated 05/14/2017, 06:45 AM
Nymex Crude at 93-93.5 Levels, Bearish Trend
Latest comments
Loading next article…
Install Our App
Risk Disclosure: Trading in financial instruments and/or cryptocurrencies involves high risks including the risk of losing some, or all, of your investment amount, and may not be suitable for all investors. Prices of cryptocurrencies are extremely volatile and may be affected by external factors such as financial, regulatory or political events. Trading on margin increases the financial risks.
Before deciding to trade in financial instrument or cryptocurrencies you should be fully informed of the risks and costs associated with trading the financial markets, carefully consider your investment objectives, level of experience, and risk appetite, and seek professional advice where needed.
Fusion Media would like to remind you that the data contained in this website is not necessarily real-time nor accurate. The data and prices on the website are not necessarily provided by any market or exchange, but may be provided by market makers, and so prices may not be accurate and may differ from the actual price at any given market, meaning prices are indicative and not appropriate for trading purposes. Fusion Media and any provider of the data contained in this website will not accept liability for any loss or damage as a result of your trading, or your reliance on the information contained within this website.
It is prohibited to use, store, reproduce, display, modify, transmit or distribute the data contained in this website without the explicit prior written permission of Fusion Media and/or the data provider. All intellectual property rights are reserved by the providers and/or the exchange providing the data contained in this website.
Fusion Media may be compensated by the advertisers that appear on the website, based on your interaction with the advertisements or advertisers.
© 2007-2025 - Fusion Media Limited. All Rights Reserved.
