Investing.com’s stocks of the week
NVIDIA (NASDAQ:NVDA) shareholders have plenty to be grateful for so far in 2019. The stock is up nearly 37% since we wrote about it in January. On the third day of the new year, NVDA was hovering around $136 a share following a sharp selloff from ~$293.

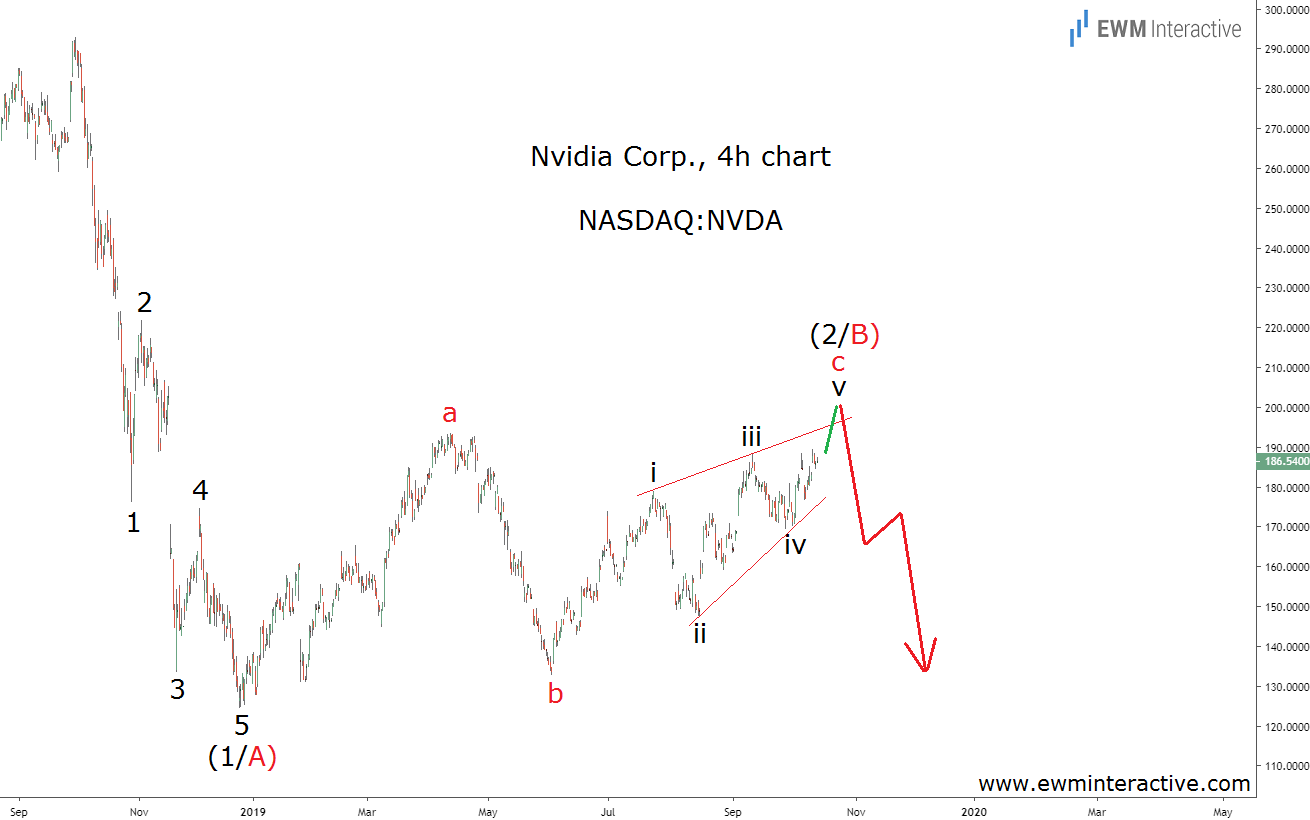
However, the five-wave impulse pattern formed by this plunge indicated that NVDA was ready for a recovery towards $180-$190. The stock reached that area in April and is once again trading within its boundaries now. The time seems right to take another look and see what to expect going forward.
The 4-hour chart reveals the impulsive crash from $293 to $125 as well as the following recovery. Wave (2/B) appears to be an a-b-c flat correction, whose wave “c” is an ending diagonal. According to the Elliott Wave theory, more weakness in wave (3/C) can be expected as soon as wave (2/B) ends.
Furthermore, wave (3/C) is supposed to breach the bottom of wave (1/A). This means targets below $124 a share are plausible, once the downtrend resumes. If this analysis is correct, NVDA can lose more than a third of its market value in the months ahead. Given the company’s cyclical nature and the numerous recession indicators flashing red, this is a warning the bulls cannot afford to ignore.
