Nasdaq 100:

Nasdaq 100: 2318.95
Short-Term Trend: sideways
Outlook:
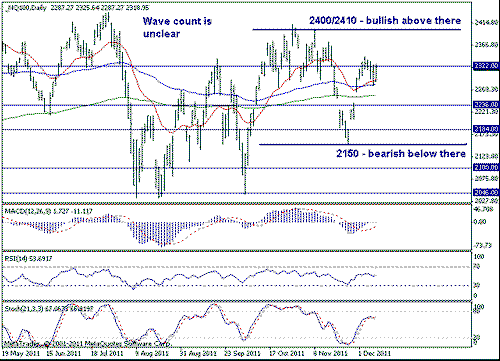
Nasdaq was little changed as it traded sideways last week. First it tried to move higher, but the upside was limited (well below the key 2400/10 resistance level). Then, there was a decline on Wednesday and Thursday to 2278 but the market then recovered nicely on Friday. Overall, on the shorter-term time frames, this price action is constructive. But until we see a clear break on the 2400/10 resistance level, the daily chart is more neutral than anything. So, if you are more aggressive, you can try the long side here as the recent price action is bullish. But if you want to see a confirmation, then one should wait for a breakout to occur first.
On the downside, the key level to watch is the late Nov low at 2150.
Strategy: Stand aside.
S&P500:

S&P500: 1255.23
Short-Term Trend: sideways
Outlook:
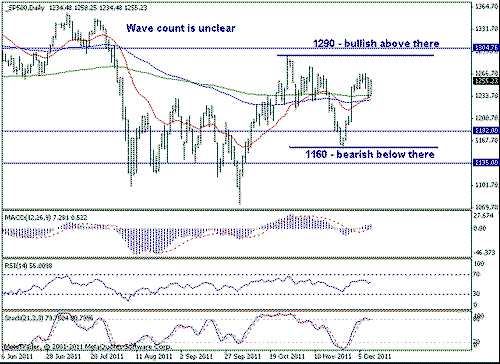
Last week the market traded sideways. It first attempted a move higher but it failed well below the key 1290 level. Then, the pullback found support at 1231 and the market rallied strongly on Friday. Overall, the hourly chart looks quite bullish and if you are more ST oriented, then the daily chart can be considered bullish as well. But until we see a clear break on the 1290 level, the daily chart is actually more neutral than bullish, so I'm still not confident in the bullish case. But a move abv 1290 should be considered quite bullish as it may trigger a move up twd the 1400 level.
On the downside, the key level to watch is the late Nov low at 1160.
Strategy: Stand aside.

Nasdaq 100: 2318.95
Short-Term Trend: sideways
Outlook:
Nasdaq was little changed as it traded sideways last week. First it tried to move higher, but the upside was limited (well below the key 2400/10 resistance level). Then, there was a decline on Wednesday and Thursday to 2278 but the market then recovered nicely on Friday. Overall, on the shorter-term time frames, this price action is constructive. But until we see a clear break on the 2400/10 resistance level, the daily chart is more neutral than anything. So, if you are more aggressive, you can try the long side here as the recent price action is bullish. But if you want to see a confirmation, then one should wait for a breakout to occur first.
On the downside, the key level to watch is the late Nov low at 2150.
Strategy: Stand aside.
S&P500:

S&P500: 1255.23
Short-Term Trend: sideways
Outlook:
Last week the market traded sideways. It first attempted a move higher but it failed well below the key 1290 level. Then, the pullback found support at 1231 and the market rallied strongly on Friday. Overall, the hourly chart looks quite bullish and if you are more ST oriented, then the daily chart can be considered bullish as well. But until we see a clear break on the 1290 level, the daily chart is actually more neutral than bullish, so I'm still not confident in the bullish case. But a move abv 1290 should be considered quite bullish as it may trigger a move up twd the 1400 level.
On the downside, the key level to watch is the late Nov low at 1160.
Strategy: Stand aside.
