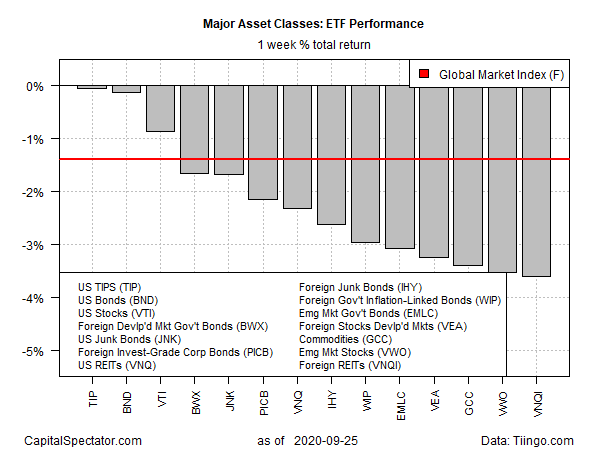
Financial gravity spared no corner of global markets last week. Selling pinched all the major asset classes for the trading week through Friday, Sep. 25, based on a set of ETF proxies.
The setbacks ranged from a trivial dip of 5 basis points for inflation-indexed Treasuries (TIPS) to a steep 3.6% slide for foreign property shares (VNQI).
It’s unusual to see across-the-board losses in the major asset classes, although the latest decline for US bonds is effectively no change, at least relative to the rest of the field.
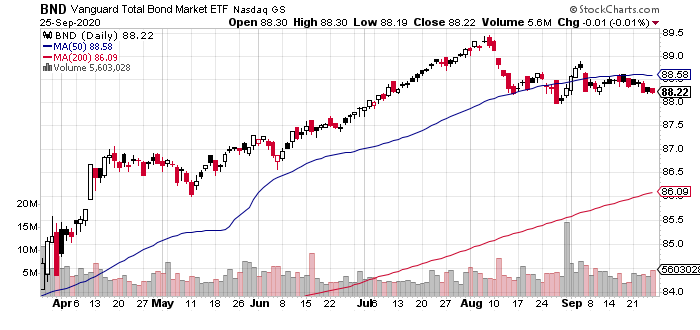
Consider the US investment-grade benchmark via Vanguard Total Bond Market Index (BND), which posted a slight 0.1% slide last week. As a stabilizing force in a diversified portfolio, BND has been useful this month. Although there are concerns that the historical role of bonds will be challenged in an ultra-low-interest-rate environment, BND has offered a degree of its usual routine by offsetting the losses in risk assets last week. For investors expecting sizeable gains, however, the latest results are disappointing. Perhaps this is as good as it gets in the new world order.

Or is it? The question is whether the traditional role of bonds in a portfolio setting will endure with rates at unusually low levels? Unclear, although the recent slippage in BND, albeit on the margins, inspires a reassessment of expectations after decades of rate declines that leave US Treasury yields near zero.
Amid last week’s widespread market declines, it’s no surprise that The Global Markets Index (GMI.F) lost ground. This unmanaged benchmark, which holds all the major asset classes (except cash) in market-value weights via ETFs, shed 1.4%.

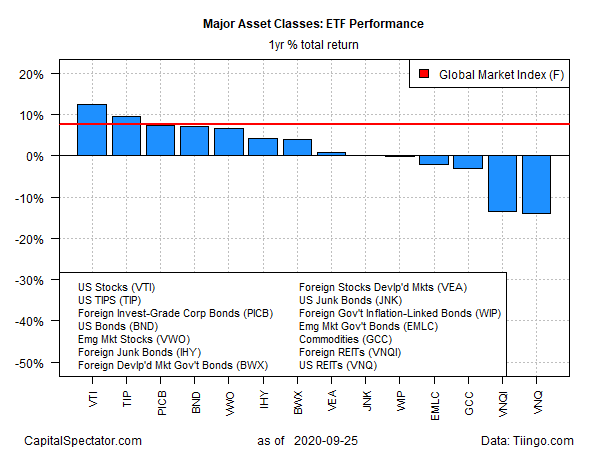
Although selling took a far-ranging bite out of prices last week, the one-year trend (252 trading days) still reflects a wide mix of profit and loss for the major asset classes. Leading the way at the moment: US equities via Vanguard Total US Stock Market (VTI), which is up 12.2% on a total return basis for the trailing one-year period.
US and foreign property shares (VNQ and VNQI, respectively) are neck and neck for the steepest one-year retreat: each ETF is down roughly 13% vs. the year-earlier level after factoring in distributions.
GMI.F continues to post a solid total return for the one-year window: 7.7%.

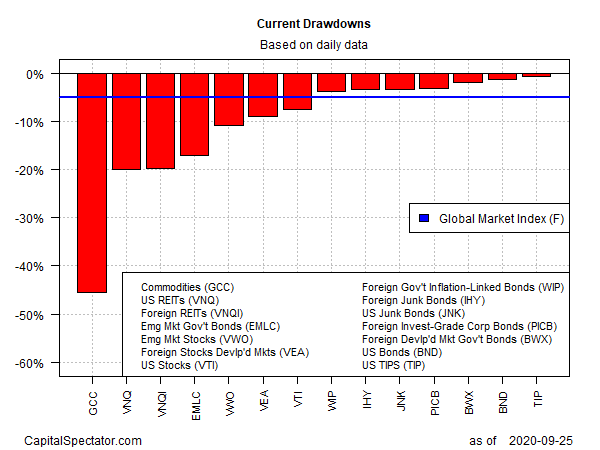
Current drawdowns for the ETF proxies tracking the major asset classes range from a slight 0.5% peak-to-trough decline for inflation-indexed Treasuries (TIPS) to a hefty 45.5% tumble for broadly defined commodities (GCC).
GMI.F’s current drawdown is a 5.5% decline from its previous high.

