Davidson submits:
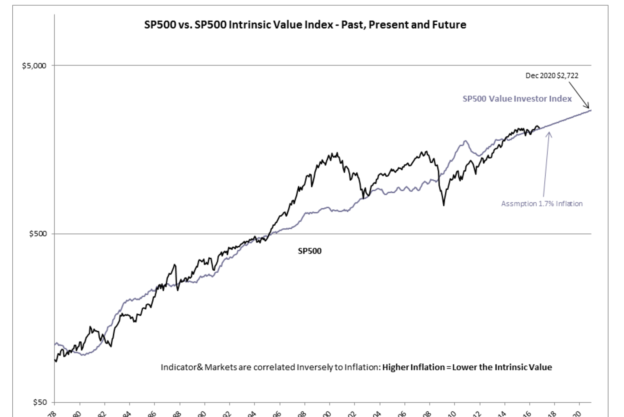
History tells us that markets do not peak till we have had a period of economic and stock market optimism. Based on the investor response to Trump’s successful Presidential bid and the last 7yrs of economic history with its level of strong pessimism, the potential exists for the market to rise to 100% in excess of the SP500 Value Investor Index in 2020 The previous 2 market peaks, 2000 and 2007, had the same level of capital dedicated to Momentum Investor strategies as we have today.
Momentum Investor capital is emotional capital. If the news is better than expected, Momentum Investors believe that markets justify higher prices. The key to understanding why they invest like this can be found in Eugene Fama’s “Efficient Market Hypothesis”.
The EMH was developed by Professor Eugene Fama who argued that stocks always trade at their fair value
Momentum Investors invest with price trends till the trend stops. Coupled intimately to the price trend is the news trend. A series of better than expected reports justifies higher market prices and a series of worse than expected reports justifies lower prices. Rarely do they view price trends the result of their own investment support of the trend. This is how markets become severely over-priced or severely under-priced.
Value Investors use fundamentals. The SP500 Value Investor Index is calculated using long-term fundamentals. This index is priced at $2,722 for December 2020. Trump’s win has spurred many to become optimistic. If we experience a lessening of the regulations which have stifled parts of our economy, one could expect a multi-year period of accelerating economic activity.
Investors could turn quite optimistic. This may lead to a repeat of over-pricing vs. the SP500 Value Investor Index. If 100% in excess of the Value Investor Index takes place in December 2020, we could see the SP500 in a range of $5,400-$5,500. One cannot predict these things, but we do have recent cycles to provide some guidance.
A particular price level does not identify a market top. The range of $5,400-$5,500 is not a forecast. History shows us that market tops occur after economic activity has peaked following a multi-year period of excessive optimism. The market will top whenever economic activity has peaked regardless of how high or how long the cycle has progressed. Considering the pessimism we have experienced the last 7yrs and the enthusiasm being finally expressed with Trump’s election, the potential for the SP500 to achieve this level is a possibility.
