-
Novo Nordisk's revenues grew 31% in 2023, driven by the success of the anti-obesity drug Wegovy.
-
As the Danish pharma giant eyes the top spot in the pharmaceutical industry, its stock faces competition from Eli Lilly and its more affordable drug Zepbound.
-
Despite current market challenges, Novo Nordisk's positive EPS forecasts, along with a robust financial health rating, suggest growth potential.
- In 2024, invest like the big funds from the comfort of your home with our AI-powered ProPicks stock selection tool. Learn more here>>
- ProPicks: stock portfolios managed by a combination of artificial intelligence and human expertise, with proven performance.
- ProTips: digestible information to simplify complex financial data in a few words.
- Fair Value and Health Score: 2 synthetic indicators based on financial data providing immediate insight into the potential and risk of each stock.
- Advanced stock screener: Find the best stocks based on your expectations, considering hundreds of metrics and financial indicators. Historical financial data for thousands of stocks: So fundamental analysis professionals can delve into all the details.
Not often you see a company worth more than its home country's GDP. But that's precisely the case for the Danish pharmaceutical behemoth Novo Nordisk (NYSE:NVO).
With a market capitalization of $540 billion, the company is now worth some $120 billion more than the $420 billion GDP recorded by its home country, Denmark, last year, according to the IMF.
In 2023, the Danish pharmaceutical giant achieved sales of $33.7 billion, marking a significant 31% increase from the previous year, while earnings per share saw a remarkable surge of over 50%.
The driving force behind the company's most recent success is the anti-obesity drug Wegovy.
Sales from that drug propelled Novo Nordisk's stock price up by 75% and secured its position as the most valuable European company on the market, surpassing luxury giant LVMH (OTC:LVMUY).
This trend has also helped push the Danish market to the best performance globally in the last 20 years compounded, as seen in the chart below: Source: Bloomberg Opinion
But such impressive performance has sparked worries that the company might be trading at unsustainable levels.
In this piece, we will take a look a the factors surrounding this impressive surge to understand whether the giant can keep growing from here.
Competition With Eli Lilly
If the past year was truly memorable, Novo Nordisk's challenge now is to become the number one pharmaceutical company in the world. At the moment, almost every big name in the industry cannot compete with the Danish company.
Currently, big industry players like Johnson & Johnson (NYSE:JNJ), Merck & Company (NYSE:MRK), Roche (OTC:RHHBY), Novartis (NYSE:NVS), and AstraZeneca (NASDAQ:AZN) are having a hard time competing with the Danish pharmaceutical giant.
However, competitor Eli Lilly (NYSE:LLY) managed to counter Novo Nordisk's innovations with the introduction of the more affordable drug Zepbound.
As a result, Eli Lilly is now the most valuable pharmaceutical company with a market cap of $689 billion, surpassing Novo Nordisk's aspirations.
What is Novo Nordisk Stock's Target Price?
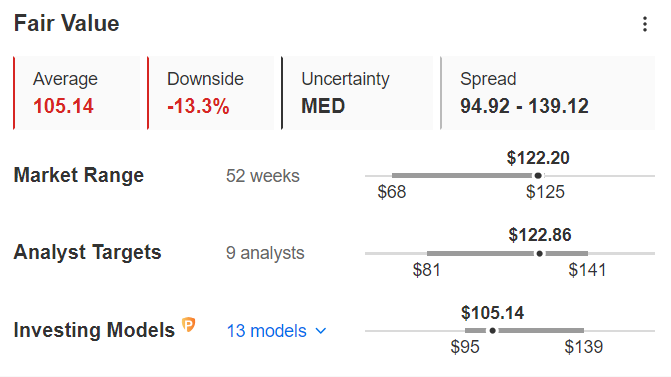
As of the closing on Feb. 27, Novo Nordisk stock is trading at $122.20 per share after a negative session (-1.04%) on Wall Street.
The quickest and most straightforward method to estimate the target price is by using InvestingPro's tools.
InvestingPro's Fair Value, which consolidates 13 recognized financial models tailored to Novo Nordisk's specific characteristics, stands at $105.14. This figure is 13.3% lower than the closing price recorded on Feb. 27. 
Source: InvestingPro
In recent weeks, InvestingPro subscribers have been tracking analysts' forecasts for Novo Nordisk.
However, the target price suggests something different compared to the Fair Value.
According to the average of 9 analysts surveyed by InvestingPro, the forecast for the stock is no longer bearish. The target price is set at $122.86 per share, reflecting a 0.8 percent increase in the stock's value.
Furthermore, on February 28th, there was a notable upward revision for the stock by analysts at Deutsche Bank.
They gave a 'buy' rating with a Target Price of $137, approximately 12.5% higher than the closing price on Feb. 27th.
EPS, Revenue Forecasts
On January 31, the Danish giant surprised the markets by reporting revenues of $9.55 billion in the last quarter of 2023 (+7.6% over consensus) and earnings per share of $0.71 (+10% over forecast).
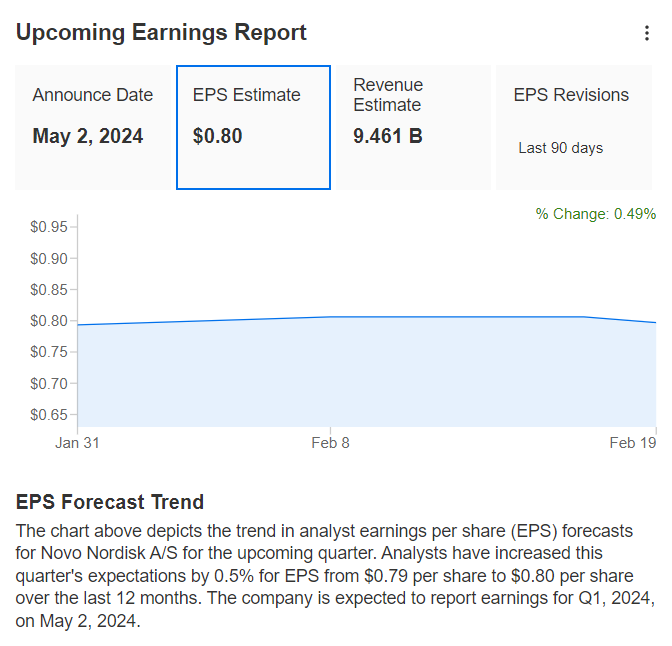
As for the Q1 2024 earnings due on May 2, markets expect the company's earnings per share to rise further with EPS estimates rising 0.5 percent in the latest period, from $0.79 to $0.80.
Revenues, on the other hand, are currently forecast at $9.46 billion, down from the previous quarter but sharply up (+20% year-on-year) from $7.89 billion in Q1 2023.

Source: InvestingPro
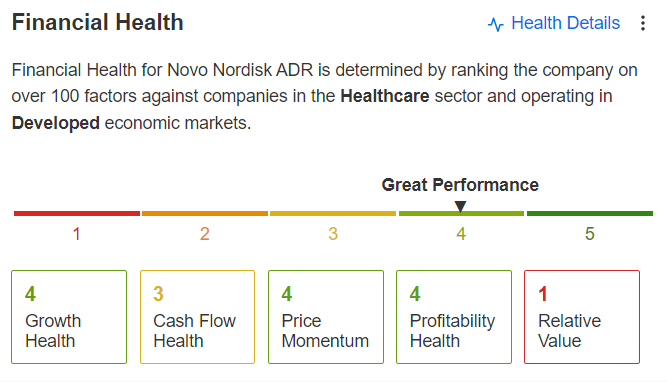
The good news for investors comes from Novo Nordisk's risk profile, which has a very strong financial health rating of 4 out of 5.

Source: InvestingPro
Conclusion
In conclusion, the stock has delivered impressive returns but It's important to note that the pharmaceutical sector is prone to volatility due to innovations that can bring about shifts in a company's market position fairly quickly.
Going forward, investors can expect increased competition among companies, bringing more twists and turns in the battle for global dominance.
Nevertheless, Novo Nordisk's robust financial health and positive forecast for next quarter's earnings per share indicate that the Danish stock still has growth potential.
***
As readers of our articles, you can take advantage of our stock strategy and fundamental analysis platform InvestingPro at a reduced price, with a 10% discount on the annual plan.
You can discover which stocks to buy and sell to outperform the market and increase your investments, thanks to a range of exclusive tools:
And many more services, not to mention those we plan to add soon! Don't face the market alone: join the thousands of InvestingPro users to make the right decisions in the stock market and boost your portfolio, whatever your profile or expectations.
Click here to subscribe with a Super discount valid for annual Pro+ subscriptions!
Don't forget your free gift! Use coupon code pro2it2024 at checkout to claim an extra 10% off on the Pro yearly and bi-yearly plans.
Disclaimer: This article is written for informational purposes only; it does not constitute a solicitation, offer, advice, counsel or recommendation to invest as such it is not intended to incentivize the purchase of assets in any way. I would like to remind you that any type of asset, is evaluated from multiple points of view and is highly risky and therefore, any investment decision and the associated risk remains with the investor.

